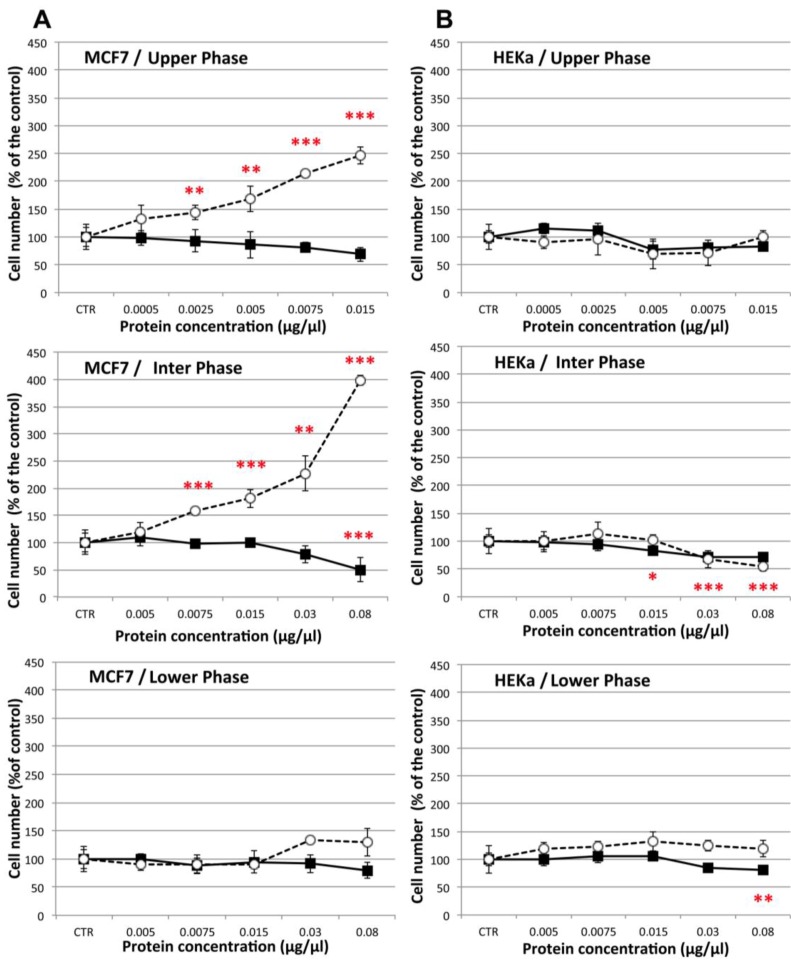
Figure 10.
Effect of different concentrations of the three C. tuberculata extract fractions on the viability of MCF-7 (A) and HEKa (B) cells measured by Trypan blue dye exclusion associated to automated cell counting. Live (black squares) and dead (open circles) cells were calculated by automatic cell counting. Data are expressed as percentage of the control and represent the mean ± SD of three independent experiments (n = 9). * p ≤ 0.05; ** p ≤ 0.03; *** p ≤ 0.01.

