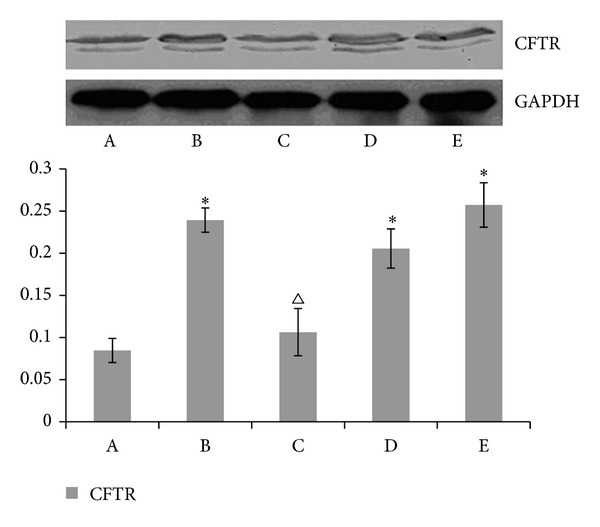
Figure 2.

The result of CFTR expression in each rat group. The CFTR protein levels were detected by Western Blot. The CFTR expression levels are expressed as a ratio to control levels. The results are representative of three separate determinations. Compared with the blank group, *P < 0.01 with the modeling group ▵ P < 0.01.
