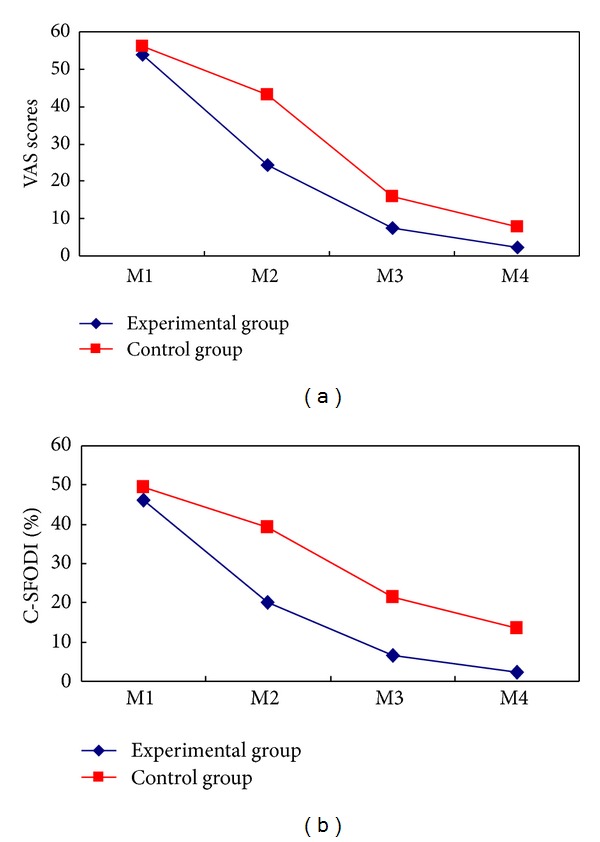
Figure 2.

Mean changes of the primary and secondary outcomes. The means of outcomes are shown for the experimental group (diamond) and the control group (squares). Measurements were obtained at baseline (M1), immediately after the last intervention (M2). The followup included the assessments at one month (M3) and six months (M4) after the last intervention. Visual analogue scale (VAS, scores rang 0 to 100) with higher scores indicating greater pain. The Chinese Short Form Oswestry Disability Index (C-SFODI, range 0 to 100%) consists of 9 questions, with higher percentage indicating more severe functional disability.
