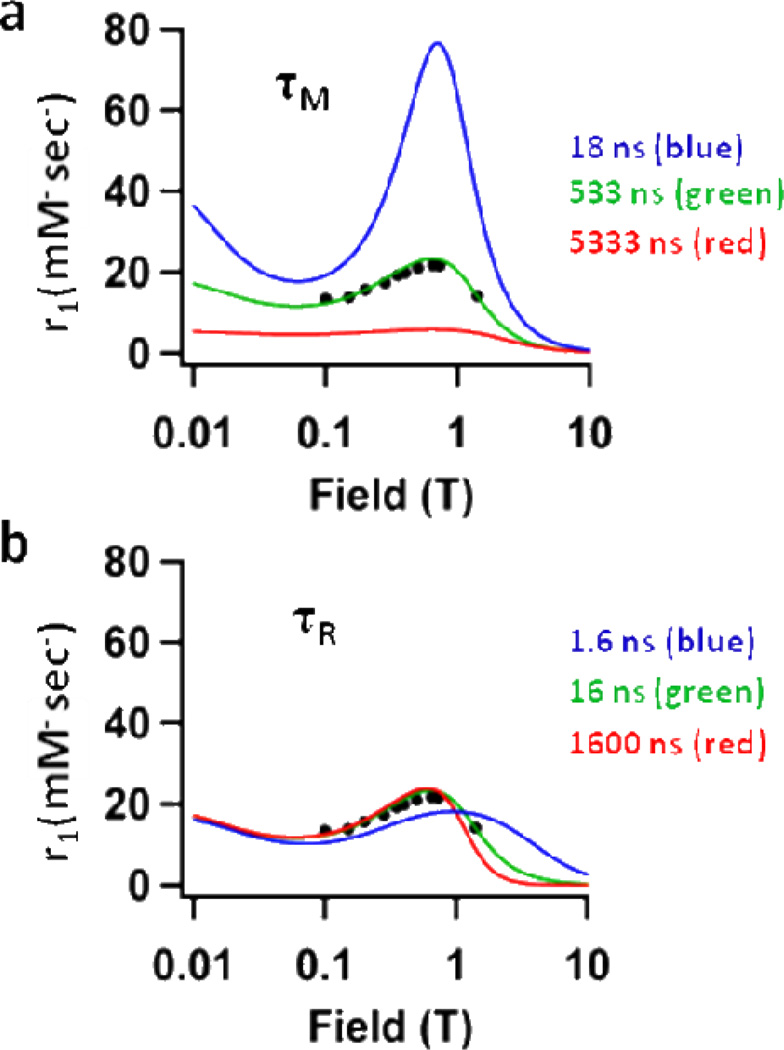
Figure 5.
Plot of P22-AACC-Gd showing r1 vs. field strength for three different values of a) τM – 18ns (blue), 533ns (green), 5333ns (red) and b) τR – 1.6ns (blue), 16ns (green), 1600ns (red). The black dots represent experimental values of r1 for P22-AACC-Gd where the green line represents the best fit to the data. The plot illustrates that τR is optimized for P22-AACC-Gd at 0.73T (max. peak height), while τM could be further improved for this system.

