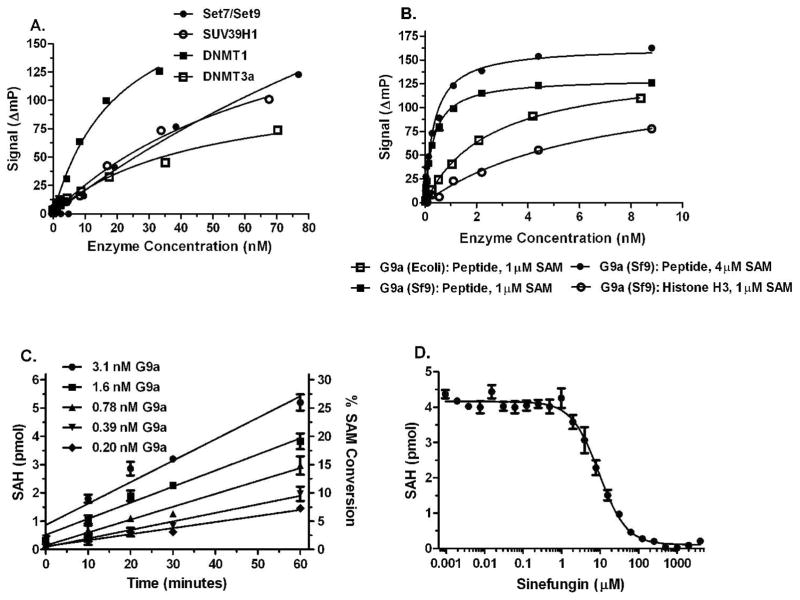
Figure 6. Detection of SAM produced in HMT and DNMT enzyme reactions.
MT enzyme reactions, initiated by the addition of SAM were incubated, quenched with 5 μl Stop Buffer, 5 μL of Detection Mix was added and plates were read after 90 min. Control reactions lacked enzyme; ΔmP = mPcontrol − mPenzyme. A) Titrations of HMTs Set7/Set9 and SUV39H1 and DNMTs 1 and 3a. Enzyme incubations were 120 min. Set7/Set9 and SUV39H1 reactions contained 50 μM peptide substrates and 6 and 12 μM SAM, respectively. DNMT reactions contained 5 μM poly d(I-C) and 3 μM SAM. B) Titration of HMT G9a from two different sources with peptide and full length histone substrates. Enzyme incubations were 120 min. Peptide substrate was present at 10 μM and Histone H3 was used at 1 μM. C) Rates of SAH formation in HMT G9a reactions. SAM/SAH standard curves were used to convert polarization data to SAH formation. D) Inhibition of HMT G9a by sinefungin. HMT G9A and detection reactions were performed as described in Materials and Methods. Enzyme incubations were 60 min. Peptide substrate was present at 20 μM and SAM was at 2 μM.

