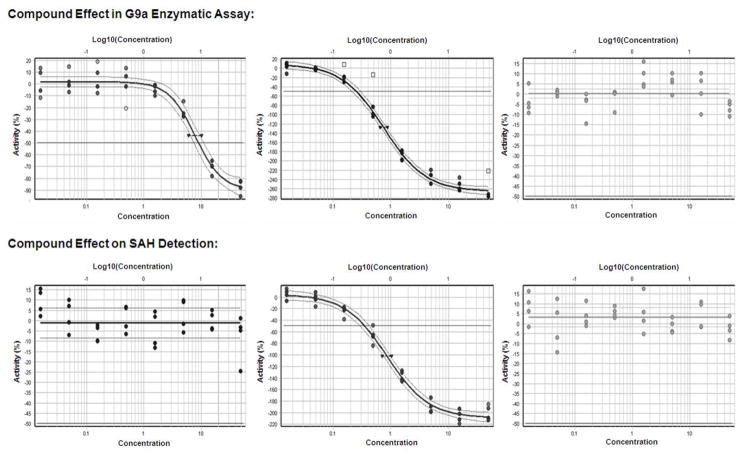
Figure 8. Hit validation in 1536-well format for different types of pilot screen hits.
Shown are results in the G9a assay (top) or the SAH counterassay (bottom) for one of the 4 primary hits specifically inhibiting G9a (left), for one of the 21 primary hits affecting both the G9a-dependent and the counterassay (middle) and for one of the 17 primary hits that were inactive in a concentration-response experiment. Note that the specific inhibition curve (left) has the inflection point around −50% inhibition and a plateau at −100% inhibition, whereas the interfering compounds (middle) reach inhibition values that exceed the no-enzyme control.

