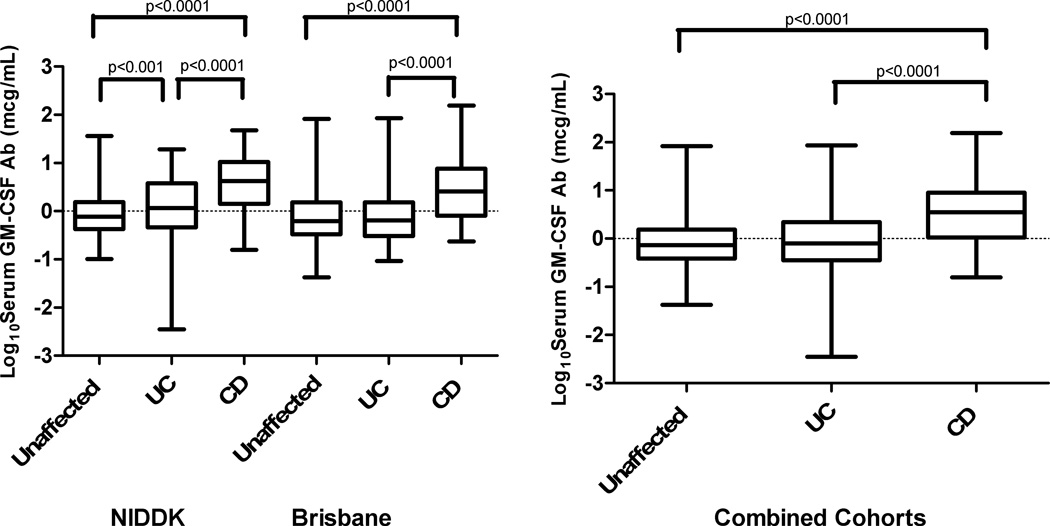
Figure 1.
Serum GM-CSF Ab Levels in Unaffected, UC, and CD Patients. The Log10 transformation of serum GM-CSF Ab (µg/ml) are shown for the NIDDK cohort, the Brisbane cohort, and the combined cohort. The middle line represents the median, and the lower edge and the upper edge of the box represent the 25% and 75% quartiles. The bottom and top lines represent the minimum and maximum values, respectively. For the Brisbane cohort there were 257 Unaffected, 255 UC and 224 CD subjects. For the NIDDK cohort there were 350 Unaffected, 139 UC and 253 CD subjects.
Kruskal-Wallis with Dunn’s post-test revealed significant differences between Unaffected and CD subjects, and UC and CD subjects in both cohorts analyzed separately and when combined. Pairwise comparison of each disease phenotype between the two cohorts revealed that the median log transformed serum GM-CSF Ab level in the NIDDK UC group was higher than the Brisbane UC group.

