
Figure 3.
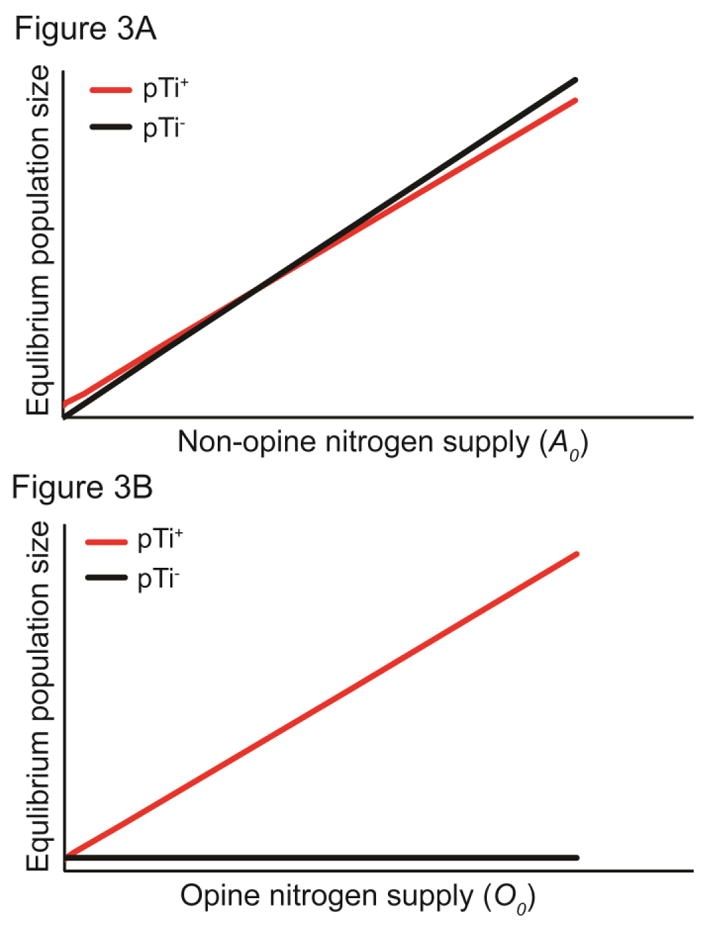
Model predictions for relationship between non-opine nitrogen supply (A) or opine nitrogen supply (B) and equilibrium population size for pTi+ and pTi− cells. Parameter values are the same as in Figure 2A.
Official websites use .gov
A
.gov website belongs to an official
government organization in the United States.
Secure .gov websites use HTTPS
A lock (
) or https:// means you've safely
connected to the .gov website. Share sensitive
information only on official, secure websites.
Model predictions for relationship between non-opine nitrogen supply (A) or opine nitrogen supply (B) and equilibrium population size for pTi+ and pTi− cells. Parameter values are the same as in Figure 2A.