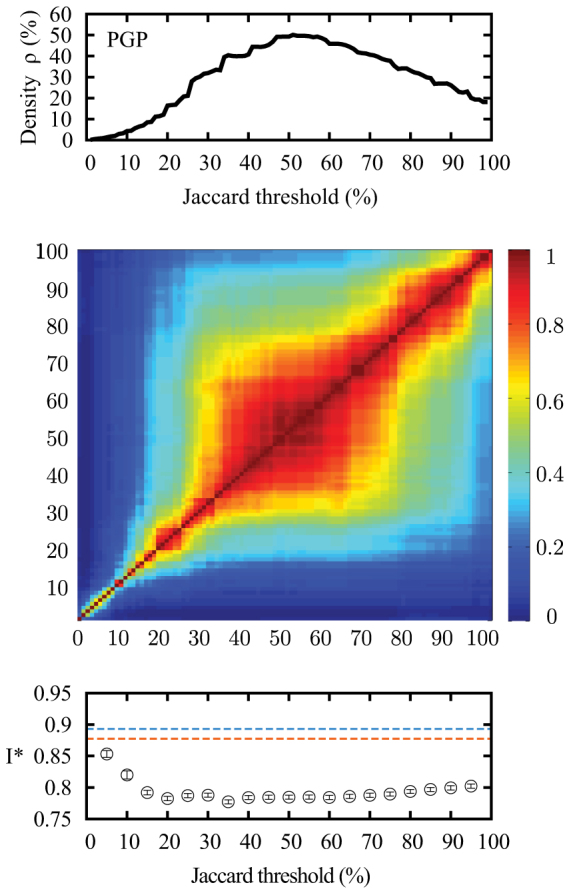
Figure 2. Robustness of structural hubs in the PGP network.

(top) Community density (ρ) obtained through different Jaccard thresholds. (middle) Robustness of the structural hubs identification methods. Element (i,j) gives the overlap (normalized) between the structural hubs (top 1%) selected with thresholds i and j. The highest line and last column of the matrix correspond to the case where the membership number equals the degree. (bottom) Prevalence I* of SIS epidemics with λ = 5 when the top 1% of structural hubs are removed (compared with the results without removal in blue or with random targets in orange).
