Figure 4.
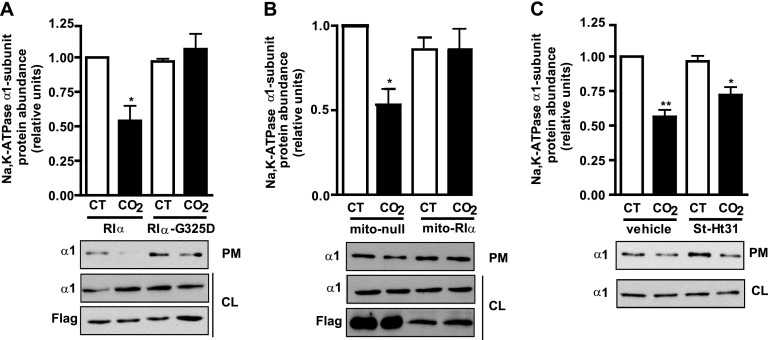
PKA Type Iα mediates the hypercapnia-induced Na,K-ATPase endocytosis in alveolar epithelial cells. (A) Graph represents the relative abundance of the Na,K-ATPase α1 subunit at the plasma membrane in A549 cells transfected with plasmids expressing Flag-RIα or the mutant Flag-RIα–G325D and exposed to 40 mm Hg Pco2 (CT) or 120 mm Hg Pco2 (CO2) for 30 minutes. Below: A representative Western blot shows the abundance of NA,K-ATPase at the plasma membrane (PM) and cell lysate (CL) and the expression levels of Flag-RIα and Flag-RIα–G325D (n = 4). (B) Graph represents the relative abundance of the Na,K-ATPase α1 subunit at the plasma membrane in A549 cells transfected with plasmids Flag-mito–null (mito-null) or Flag-mito–RIα (mito-RIα) and exposed to CT or CO2 for 30 minutes. Below: A representative Western blot shows the abundance of Na,K-ATPase at the plasma membrane (PM) and cell lysate (CL) and the expression levels of Flag-mito–null and Flag-mito-RIα (n = 3). (C) Graph represents the relative abundance of the Na,K-ATPase α1 subunit at the plasma membrane in ATII cells preincubated for 30 minutes with vehicle or 10 μM St-Ht31 before exposure to CT or CO2 for 30 minutes. Below: A representative Western blot shows the abundance of Na,K-ATPase at the plasma membrane (PM) and cell lysate (CL) (n = 6). *P < 0.05. **P < 0.01.

