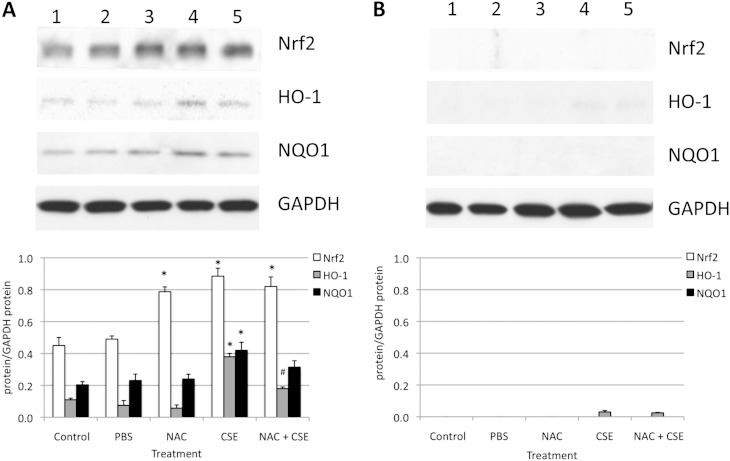
Figure 6.
Protein expression in ATII cells isolated from Nrf2+/+ mice (A) and Nrf2−/− mice (B) after treatment with 0.5 μM NAC for 24 hours, followed by 3% CSE for 24 hours in vitro (by immunoblotting). Lane 1, control; lane 2, PBS; lane 3, 0.5 μM NAC; lane 4, 3% CSE; lane 5, 0.5 μM NAC and 3% CSE. The relative expression of these proteins is also shown. *Statistically significant increase in comparison with control samples (P < 0.05). #Statistically significant decrease in comparison with CSE alone.

