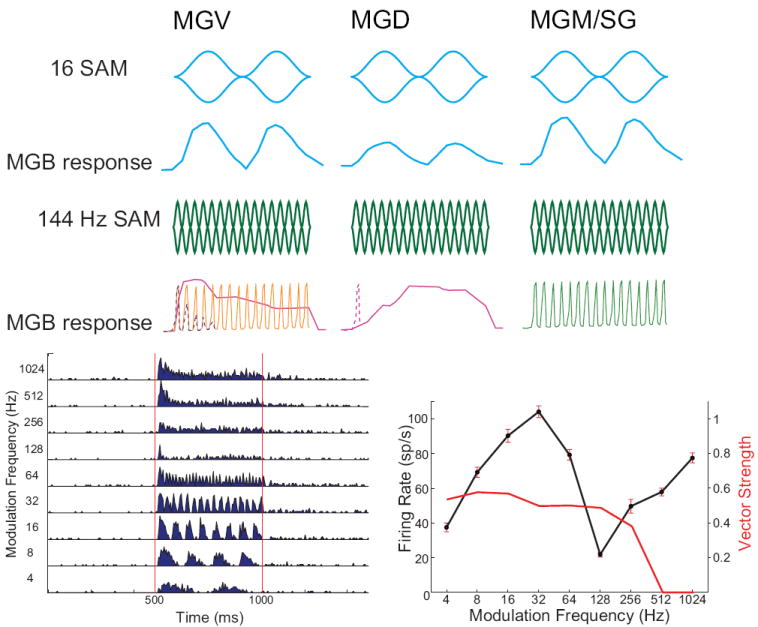
Figure 4. Responses to sinusoidal amplitude modulation in different MGB subdivisions.

Top row: Modulation waveforms for 16 Hz sinusoidal AM (SAM), 100% modulation depth. Second row: MGB response to 16 Hz SAM. For low modulation frequencies (<32 Hz), MGV neurons (left) represent both periodicity and modulation waveform in their discharges. Firing rate curves represent peristimulus time histogram (PSTH) responses. MGD neurons (middle), if responsive, often have lower evoked firing rates but are often sometimes synchronized for low modulation frequencies. MGM neurons (right) respond similarly to MGV neurons at low modulation frequencies despite receiving IC inputs with different tuning and axon terminal sizes. Third row: Modulation waveforms for 144 Hz sinusoidal AM, 100% modulation depth. Fourth row: MGV neurons have three common responses to high frequency AM when recording from unanesthetized animals. Left: Some MGV neurons respond only phasically (dashed line). Others are able to maintain synchronized responses for the duration of the AM stimulus. Some MGV neurons respond with sustained increases in firing rate that are not synchronized with the AM modulation frequency. Middle: Most MGD neurons, when responsive, generate a long-latency sustained increase in firing rate for rapid AM stimuli (solid line) or just a brief onset (dashed line). Right: Many MGM neurons (guinea pig) and anterodorsal neurons (marmoset) are able to represent rapid temporal modulations with relatively precise synchrony compared to other MGB subdivisions. Fifth row, left: Example of a MGV neuron response to SAM. Same neuron as Fig. 6B. SAM tone, carrier frequency = 6.96 kHz, 70 dB SPL, 4-1024, 1 octave steps. Shown is the PSTH in response to SAM sounds. Red lines show when sound was playing. Fifth row, right: Mean firing rate (solid line) ± SEM for same unit. Also shown is vector strength (red line), where those that were not significantly synchronized were set to 0.
