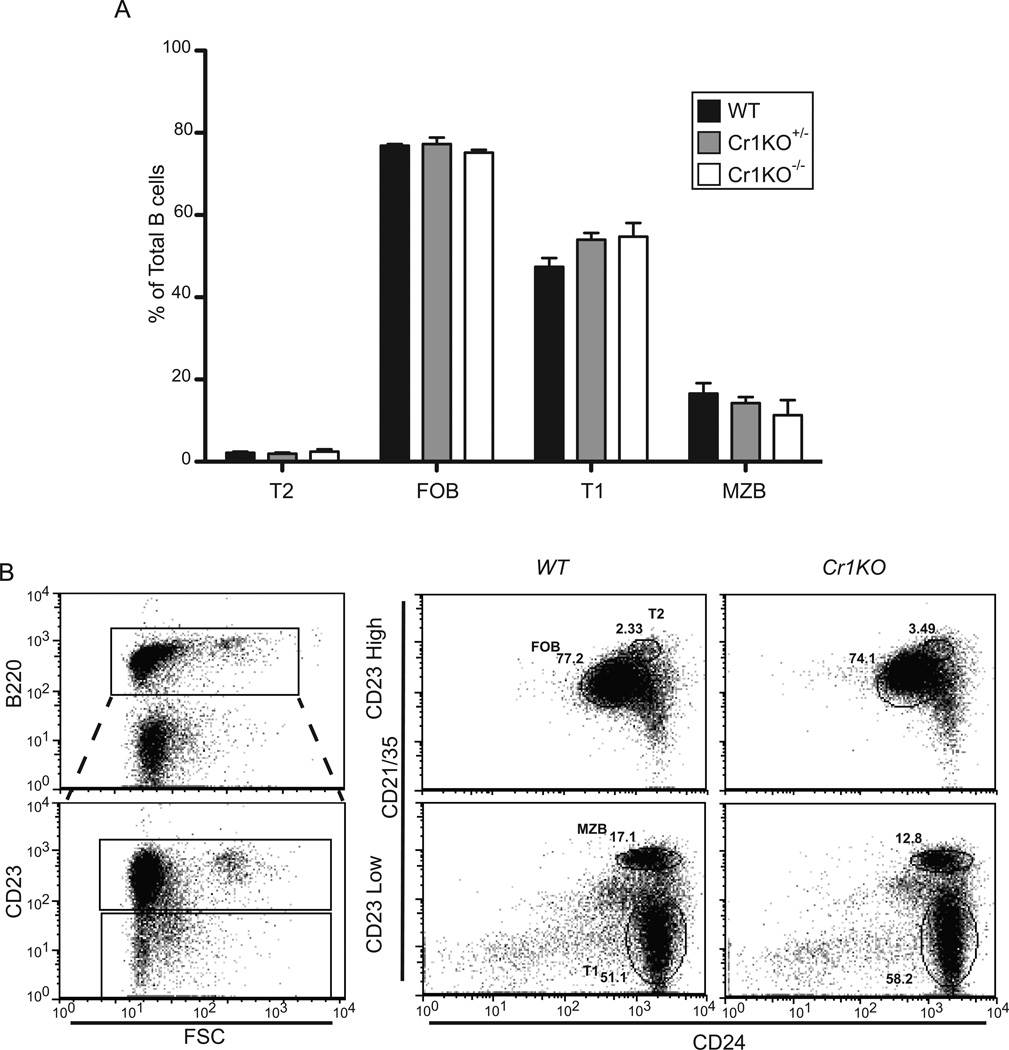
Figure 4.
Analysis of Cr1KO splenic B cell populations. A, Quantification of transitional 1 (T1), T2, follicular mature (FOB), and marginal zone (MZB) B cell population frequencies in homozygous and heterozygous Cr1KO compared to WT mice. Populations were determined by segregating all B220+ splenocytes into CD23hi and CD23lo populations and defining the T1, T2, FOB, and MZB B cells by differential expression of CD24 and CD21/35. Representative plots of WT and Cr1KO are shown in panel B. (n=3 littermates, C57BL/6 background; One-way ANOVA performed on each population set).

