Figure 6.
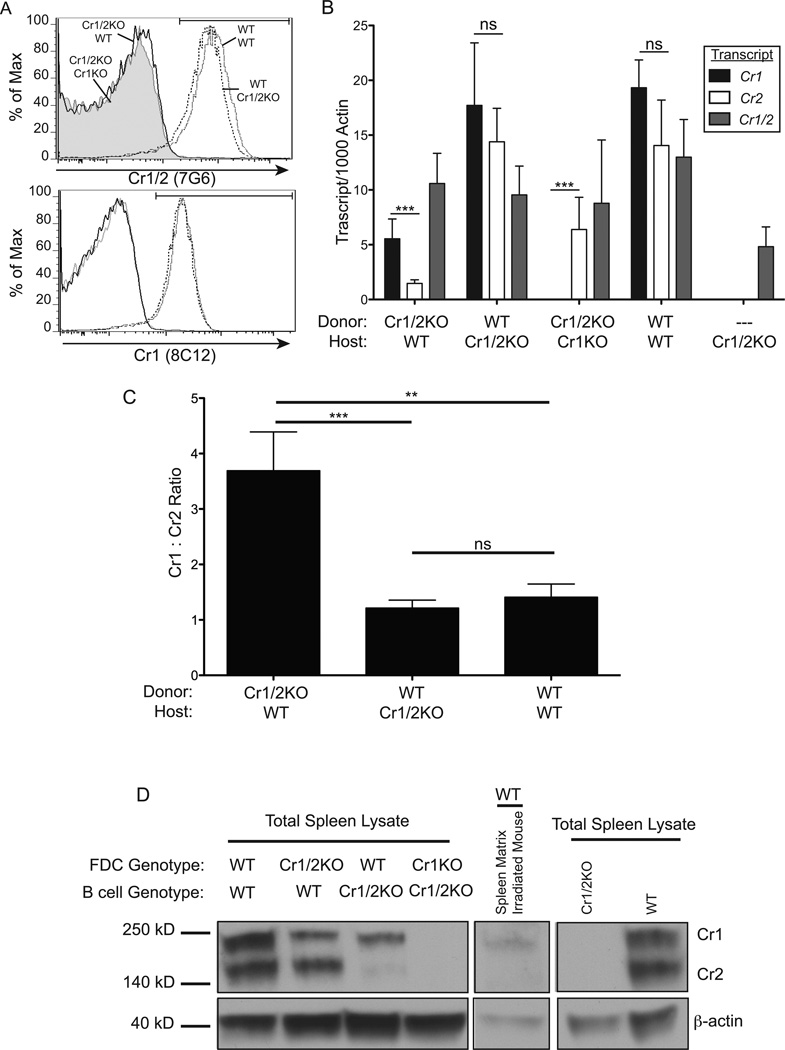
Quantitative RT-PCR and immunoblot analysis of Cr1 and Cr2 expression on FDC and B cells. A, Representative histograms of surface CR1 and CR1/2 on live peripheral blood B220+ cells - from WT(donor) →WT(host) (gray line), WT→Cr1/2KO (dotted line), Cr1/2KO→WT (black line), Cr1/2KO→Cr1KO (gray fill) - demonstrating full engraftment 6 weeks after bone marrow transplant into lethally irradiated mice. B, Quantitative RT-PCR analysis of Cr1 (black bars), Cr2 (white bars), and Cr1/2 (gray bars) transcript in total spleen cDNA isolates from bone marrow chimeras. C, Ratio of Cr1:Cr2 transcripts quantified in (B) from Cr1/2KO→WT, WT→Cr1/2KO, and WT→WT chimeras. D, Immunoblot analysis of the 190kD Cr1 and 140kD Cr2 proteins in total spleen lysates from chimeras (left panel), a mouse two days post-lethal irradiation (center panel), and control Cr1/2KO and WT (right panel). (n=8 Cr1/2KO→WT; n=3 WT→Cr1/2KO; n=9 Cr1/2KO→Cr1KO; n=2 WT→WT; n=4 Cr1/2KO; error bars represent SEM; ns=not significant, **=p<0.01, ***=p<0.001 by student’s t-test) (β-actin was used as a loading control; 40kD).

