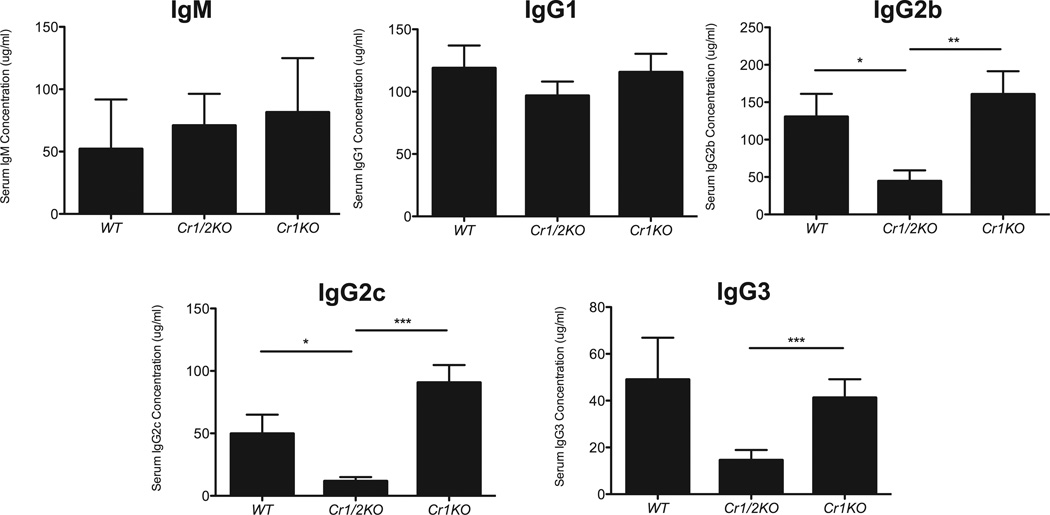
Figure 7.
ELISA quantification of naïve serum immunoglobulin. Concentration of total IgM, IgG1, IgG2b, IgG2c, and IgG3 immunoglobulin isotypes from serum of naïve WT, Cr1KO, and Cr1/2KO mice. (n=11; 8–16 week old sex matched mice; error bars represent SEM; *=p<0.05, **=p<0.01, ***=p<0.001 by student’s t-test).

