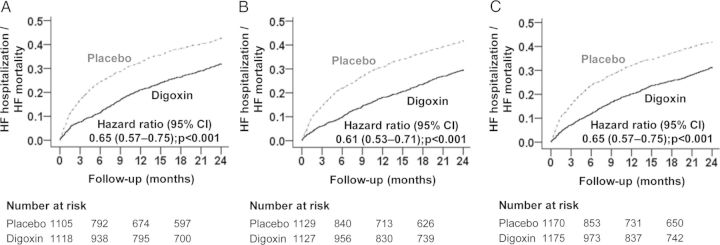
Figure 1.

Kaplan–Meier plots for heart failure (HF) mortality or HF hospitalization by treatment groups in high-risk patients with chronic HF in the DIG trial: (A) NYHA class III–IV, (B) LVEF <25%, and (C) cardiothoracic ratio >55%. CI, confidence interval.
