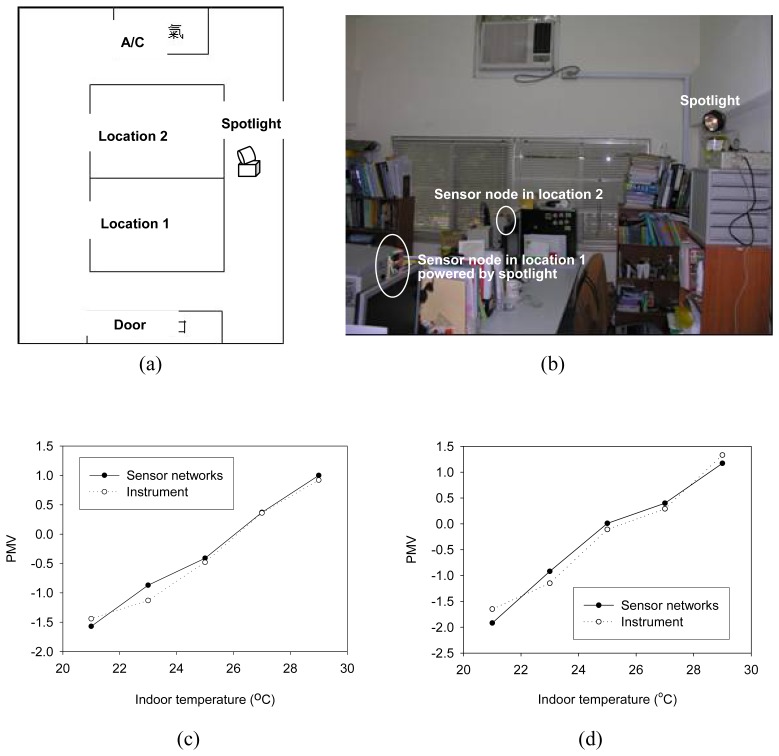
Figure 5.
PMV indices in the simulated thermal environment. The schematic view of the space arrangements is shown in (a). The photograph of the light powered sensor networks assembled in the thermal environment is shown in (b). Panel (c) and (d) illustrate the PMV indices obtained by the commercial instrument and the light powered sensor networks at the location 1 and 2 respectively.

