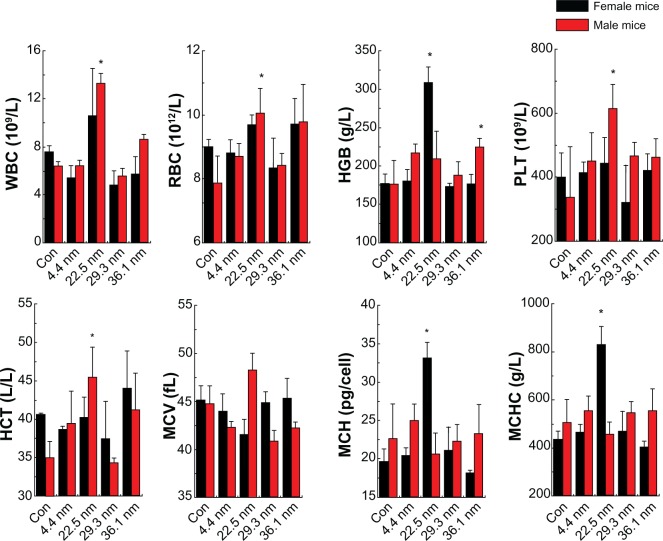
Figure 5.
Hematology results of the nanoparticles, including the hematology results of the female and male mice. These results show means and standard deviation of white blood cells (WBC), red blood cells (RBC), hemoglobin (HGB), platelets (PLT), hematocrit (HCT), mean corpuscular volume (MCV), mean corpuscular hemoglobin (MCH), and mean corpuscular hemoglobin concentration (MCHC). Bars represent means ± standard deviation. Data were analyzed by Student’s t-test, and stars represent significant differences from the control (Con) group (P <0.05). * Represent significant differences from the control.

