Figure 5.
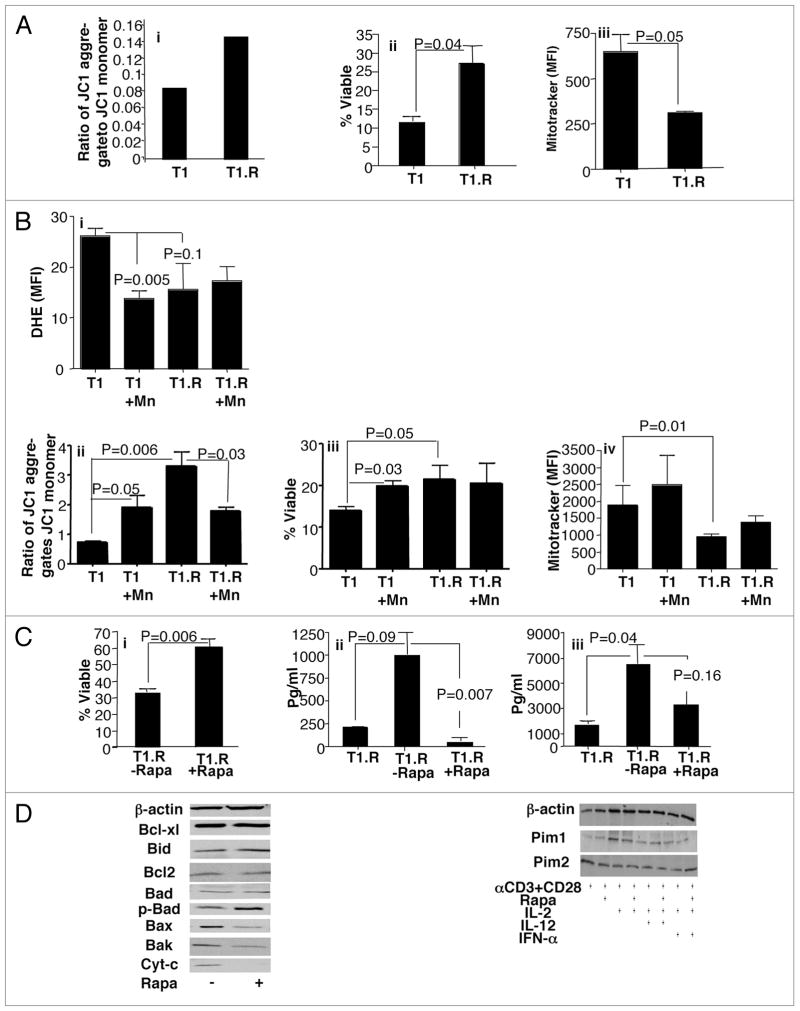
Anti-apoptotic T1.R cells: bcl-2 family balance and role of autophagy. Human Th1/Tc1 cells were generated by co-stimulation, IFNα priming, and culture either without rapamycin (“T1”) or with rapamycin (“T1.R”) for six days. (A) Th1/Tc1 cells were subjected to repeat co-stimulation and evaluated for integrity of mitochondrial membrane potential by flow cytometry, as reflected by maintenance of a high ratio of JC1 aggregates relative to JC1 monomers (part i), representative result from one of three experiments. Percent viability of T1 and T1.R cells was determined by flow cytometry after staurosporine stimulation on day 6 of culture (part ii, data pooled from three independent experiments). Mitochondria mass was measured by flow cytometry using Mitotracker Green (part iii, n = 3). (B) ROS was measured using dihydroethidium (DHE) expression in T1 and T1.R cells. MnTBAP was using to block ROS in some cultures; subsequently, the effect on T cell mitochondrial membrane potential, viability and mitochondria mass were measured. ROS results in T1 and T1.R cells either with or without ROS inhibitor treatment are shown in part i (n = 3).
Mitochondrial membrane potential results are shown in part ii (n = 3). Total T cell viability is shown in (part iii) (n = 3), whereas total mitochondria mass is shown in part iv (n = 3). (C) T1.R cells were harvested on day 6, washed and re-seeded at 0.5 × 10⁶/ml in T1 media either with rapamycin (“+”) or without rapamycin (“−”) for an additional 6 days. At day 12, T1 cells were challenged with staurosporine and the frequency of viable cells was determined (part i; n = 3 experiments). Cytokine secretion capacity was determined on the parent culture at day 6 of culture (T1.R) and at day 12 of culture by testing cytokine content of supernatants generated by repeat co-stimulation (part ii, IL-2 secretion; (part iii), IFNγ secretion). (C) Protein lysate was obtained from control T1 cells (“−”) or T1.R cells (“+”) and subjected to western blot analysis for analysis of bcl-2 family gene member expression (left), and pim kinase expression (right).

