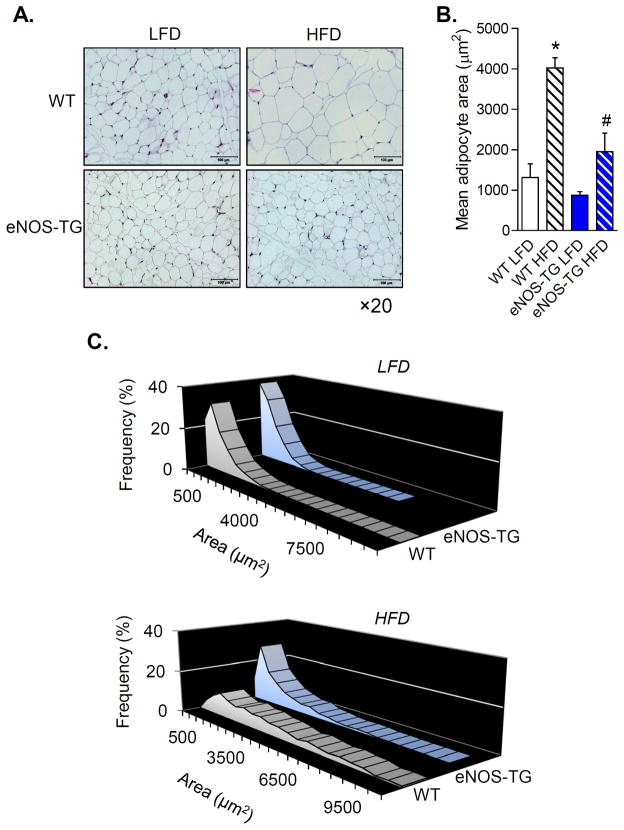
Figure 4. eNOS overexpression decreases diet-induced adipocyte hypertrophy.
Adipocyte size measurements from WT and eNOS-TG mice fed a LFD or HFD for 6 weeks: (A) Representative hematoxylin and eosin-stained images of adipose tissue from the epididymal fat pad (×20 magnification; scale bar = 100 μm); (B) Mean adipocyte area; (C) Distribution of adipocyte sizes from mice fed a LFD (upper panel) and a HFD (lower panel). n = 5 per group, *p<0.05 vs. WT LFD; #p<0.05 vs. WT HFD.

