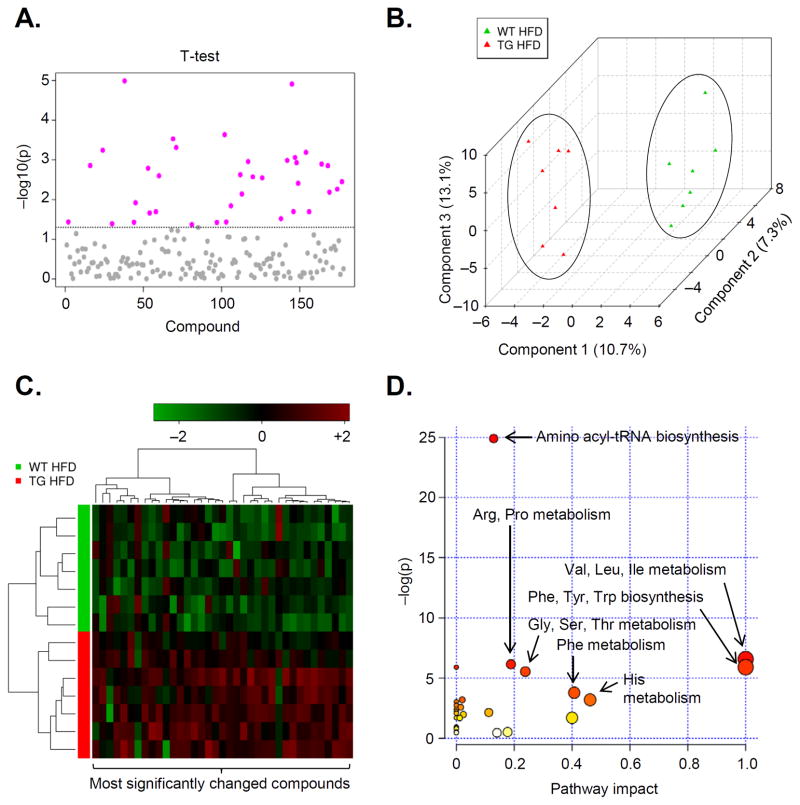
Figure 5. Metabolomic analyses of adipose tissues from high fat-fed mice.
Metabolomic analyses of epididymal adipose tissue metabolites from WT and eNOS-TG mice fed HFD for 6 weeks: (A) Univariate analysis: t-tests of compounds from adipose tissues. All metabolites above the dotted line were found to be significantly different between WT and eNOS-TG mice (p<0.05). A table of these metabolites can be found in the data supplement (Online Table II); (B) Multivariate analysis: partial least squares-discriminant analysis (PLS-DA); (C) Hierarchial clustering: Heatmap and dendogram using the the most significantly different metabolites. (D) The significant metabolites were subjected to pathway impact analysis using Metaboanalyst MetPA and the Mus musculus pathway library. Fisher’s exact test was used for overrepresentation analysis, and relative betweenness centrality was used for pathway topology analysis. n = 14 animals: 7 WT HFD, 7 eNOS-TG HFD.

