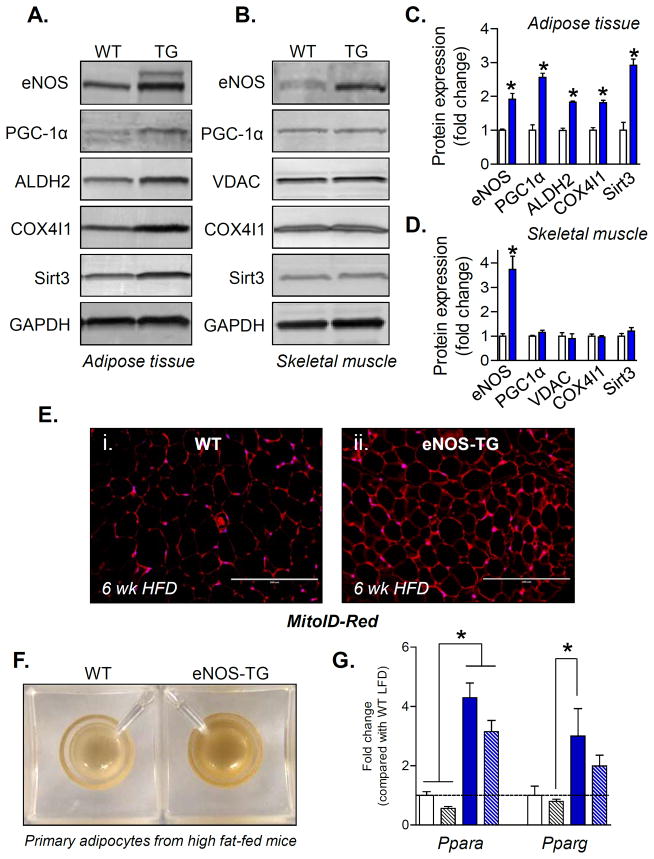
Figure 7. Mitochondria are increased in the adipose tissue of eNOS-TG mice.
Measurements of mitochondria in epididymal adipose tissue and skeletal muscle from WT and eNOS-TG mice: (A) Representative Western blots of adipose tissue eNOS, PGC1α, ALDH2, COX4I1, and Sirt3; GAPDH was used as a loading control. (B) Representative Western blots of skeletal muscle eNOS, PGC1α, VDAC, COX4I1, and Sirt3. GAPDH was used as a loading control. (C) Quantification of protein expression from panel A. (D) Quantification of protein expression from panel B. n=3 per group; *p<0.05 vs. WT; White bars, WT; blue bars, TG. (E) Immunofluorescence images of adipose tissue sections from HF-fed WT (panel i) and eNOS-TG (panel ii) mice; the sections were stained with MitoID-Red as a qualitative index of mitochondrial mass. Scale bar=200 μM (F) Representative photomicrograph of adipocytes isolated from HF-fed WT and eNOS-TG mice (600,000 adipocytes per well). (G) mRNA analysis of Ppara and Pparg. White bars, WT LFD; blue bars, eNOS-TG LFD; white hatched bars, WT HFD; blue hatched bars, eNOS-TG HFD; n=6 per group; *p<0.05 vs. indicated groups.

