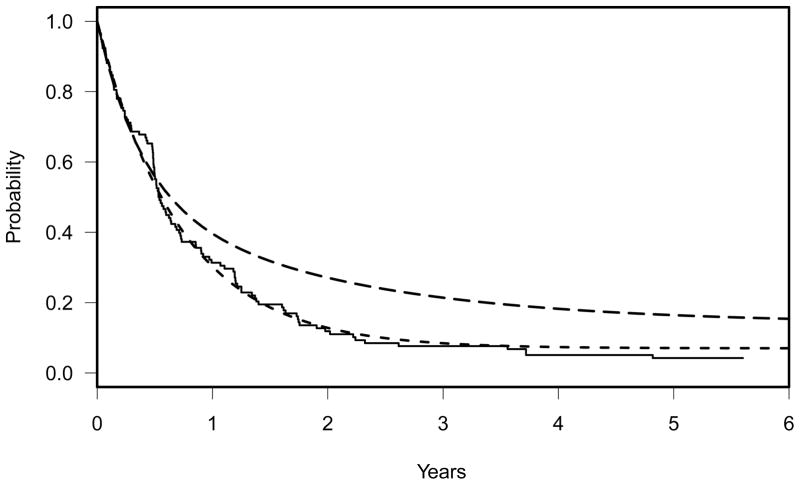
Figure 1.
Solid line: Kaplan-Meier curve of the previous ECOG trial, E3993. Dashed line: two component-cure rate model, Sp(t) = 0.07 + 0.93 exp(−t log(2)/6), representing the null hypothesis. Long dashed line: three-component cure rate model, Sm(t) = 0.14 + 0.39 exp(−t log(2)/15) + 0.47 exp(−t log(2)/3.1), representing the alternative hypothesis(HA: Sp(t) < Sm(t)).

