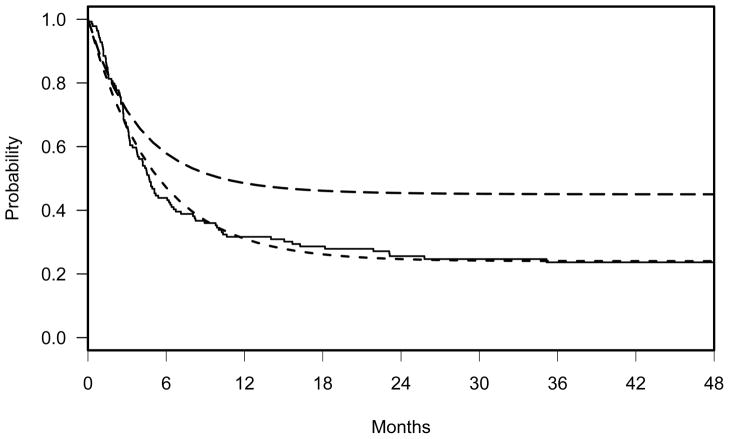
Figure 3.
Solid line: Kaplan-Meier curve of the previous study. Dashed line: two-component cure rate model, SB = 0.24+ 0.76*exp(−t*(log(2)/3.5)), representing the null hypothesis. Long dashed line: three-component cure rate model, SA = 0.45+0.45*exp(−t*(log(2)/2.5))+ 0.1*exp(−t*(log(2)/4.5)), representing the alternative hypothesis (HA: SB(t) < SA(t)).

