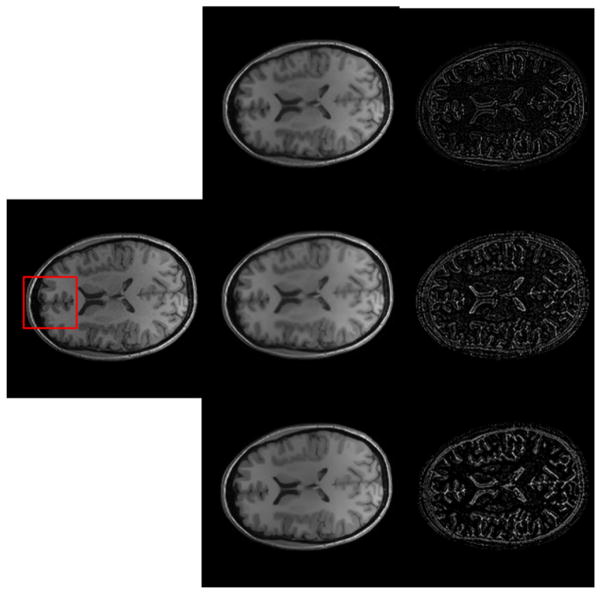
Figure 12.
Qualitative comparison of denoising results obtained with different methods. The first column is the real MR brain image without any processing. From top to bottom, the second column is the denoised results by Wiener, wavelet, and our method, respectively. The third column is the corresponding residuals between the original image and denoised image.

