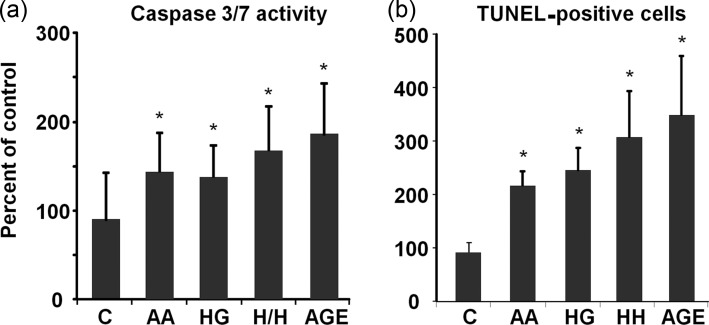
FIGURE 5:
Mesangial cell apoptosis in metabolic stressor conditions. (a) Caspase 3/7 activity was measured after 1 day (n = 12) and (b) TUNEL staining after 2 days (n = 6) of exposure to metabolic stressor conditions. Data are expressed as mean ± SD, *P < 0.05 versus control. Metabolic stressor conditions included: (i) C: control (no addition), glucose 5.5 mM; (ii) AA: increased amino acids, levels 4–6-fold >control; (iii) HG: high glucose, glucose 30.5 mM; (iv) AA/HG: combination of AA and HG; (v) AGE-bovine serum albumin (AGE-BSA, 300 µg/mL).

