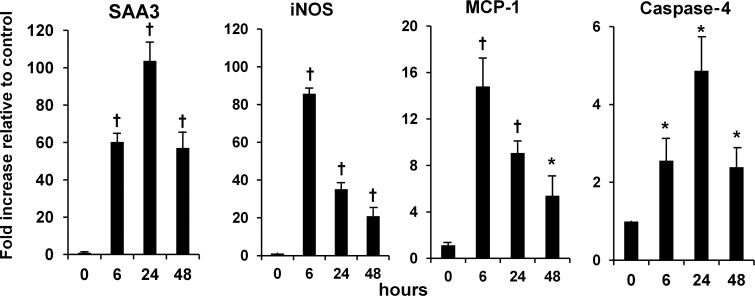
FIGURE 7:
Time course of SAA and other inflammatory mediators in mesangial cells stimulated with AGE. Cells were exposed to (i) control (no addition) and (ii) AGE (AGE-BSA, 300 µg/mL). Expression of mRNA was determined by real-time RT–PCR and displayed relative to control (n = 3). Data are expressed as mean ± SD, *P < 0.05 versus control, †P < 0.01 versus control.

