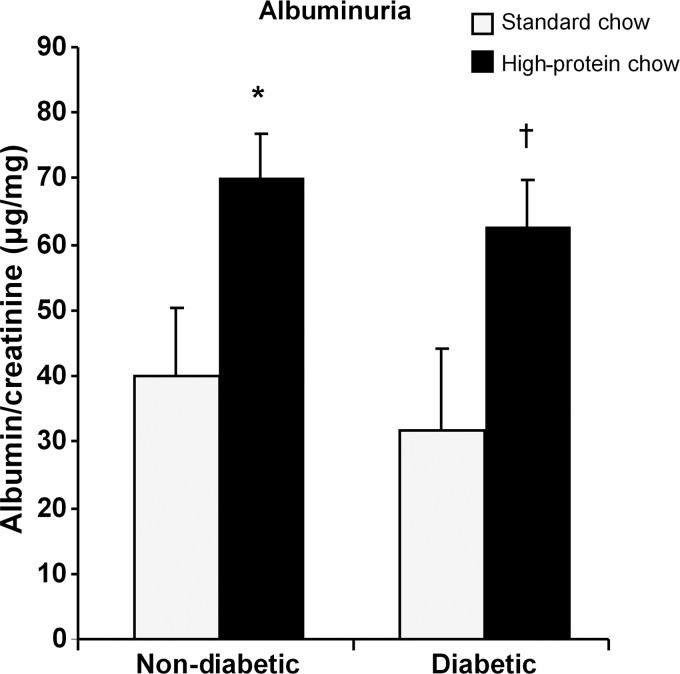
FIGURE 8:
Urine albumin was increased in both nondiabetic and diabetic mice fed the high-protein chow (n = 9, nondiabetic mice/standard chow; n = 10, nondiabetic mice/high-protein chow; n = 12 diabetic mice/standard chow and n = 19, diabetic mice/high-protein chow). Data are expressed as mean ± SD, *P = 0.009 versus nondiabetic mice fed a standard chow, †P = 0.005 versus diabetic mice fed the standard chow.

