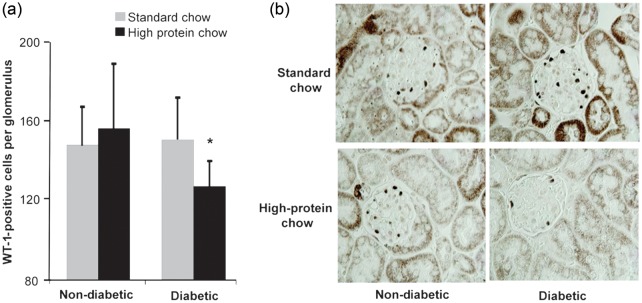
FIGURE 9:

(a) Podocyte number in glomeruli of nondiabetic and diabetic mice fed normal or high-protein diet for 20 weeks (n = 10). Data are expressed as mean ± SD; *P = 0.007 compared with a diabetic standard chow. (b) Representative photomicrograph of WT-1 staining in mouse kidneys (original magnification ×1000).
