Figure 5.

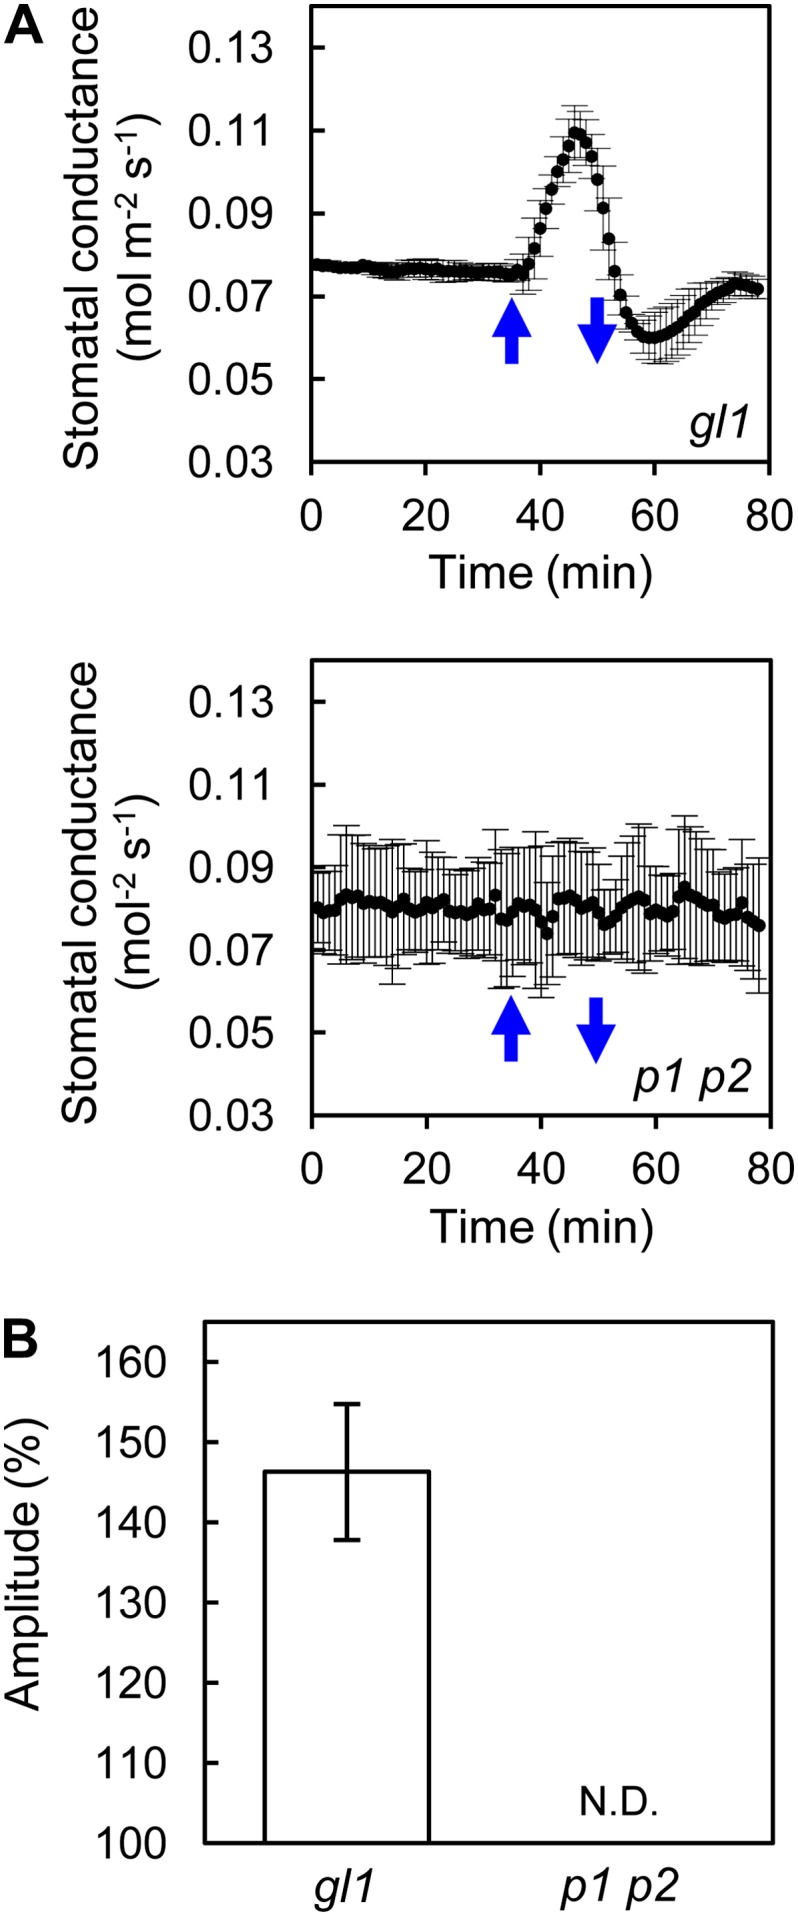
Stomatal conductance in phot1 phot2 in response to short-term blue light irradiation. A, Fluctuation of stomatal conductance in phot1 phot2 (p1 p2) and corresponding background plant (gl1) leaves in response to blue light. Leaves were illuminated with a strong red light (550 µmol m–1 s–1) as a background to stabilize the conductance before illumination with blue light. Upward and downward blue arrows indicate the start and termination, respectively, of illumination for 15 min with blue light (20 µmol m–1 s–1 for phot1 phot2 and 5 µmol m–1 s–1 for gl1). Data represent means of three independent experiments with sd. B, Amplitude of the stomatal conductance in response to blue light. The amplitude is shown as a percentage against a steady state set to 100%. Data represent means of three independent experiments with sd. N.D., Not detected.
