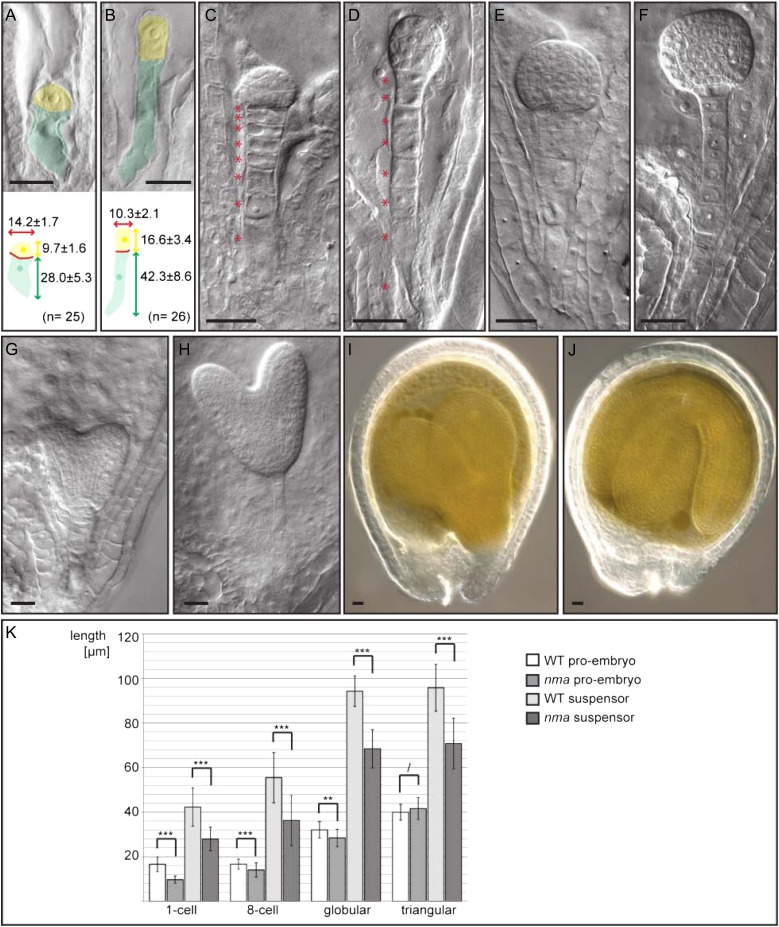
Figure 1.
Embryonic phenotype of nma mutants compared with the wild type. A and B, Embryonic phenotype at one-cell stage of nma (A) and the wild type (B). Apical cells are false colored in yellow; basal cells are false colored in green. Measurements are given as average with sd in micrometers. C and D, Embryonic phenotype at 16-cell stage of nma (C) and the wild type (D). Suspensor cells are highlighted by accompanying asterisks. E and F, Late globular stage embryos of nma (E) and the wild type (F). G and H, Heart stage embryos of nma (G) and the wild type (H). I and J, Developing seed of nma (I) and the wild type (J) 7 dap. Bars = 20 µm. K, Measurements of embryo proper and suspensor length at different developmental stages. Number of analyzed embryos at one-cell stage: nma, n = 26 and the wild type, n = 26. Number at eight-cell stage: nma, n = 101 and the wild type, n = 98. Number at globular stage: nma, n = 36 and the wild type, n = 29. Number at triangular stage: nma, n = 54 and the wild type, n = 33. Mean values with sd are shown. Significant differences were determined in pairwise comparison by Mann-Whitney U test (* = P < 0.05, ** = P < 0.01, *** = P < 0.001, and / = P > 0.05). WT, Wild type.

