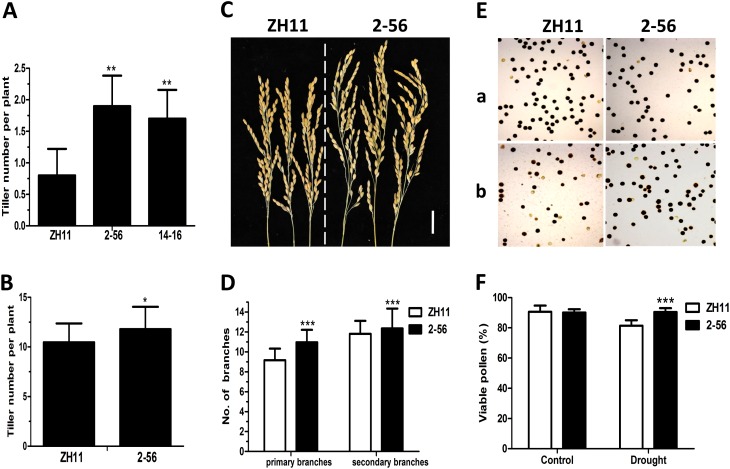
Figure 2.
Improved yield components in transgenic rice. A and B, Comparison of tiller number. Tiller number of 6-week-old plants (A) or plants at mature stage (B). Twenty plants were used for each line. Values are mean ± sd (**P < 0.01). C, Comparison of panicles of the transgenic rice and ZH11. Bar = 5.5 cm. D, Number of primary and secondary branches per panicle. Values are mean ± sd (n = 30, ***P < 0.001). E, Pollen viability between transgenic and control plant. Mature pollens under normal conditions (a) and after 4 d of drought stress (b) stained with iodine-potassium iodide. F, Viable pollen ratio between transgenic and control plants before and after drought treatment. Values are mean ± sd (***P < 0.001).

