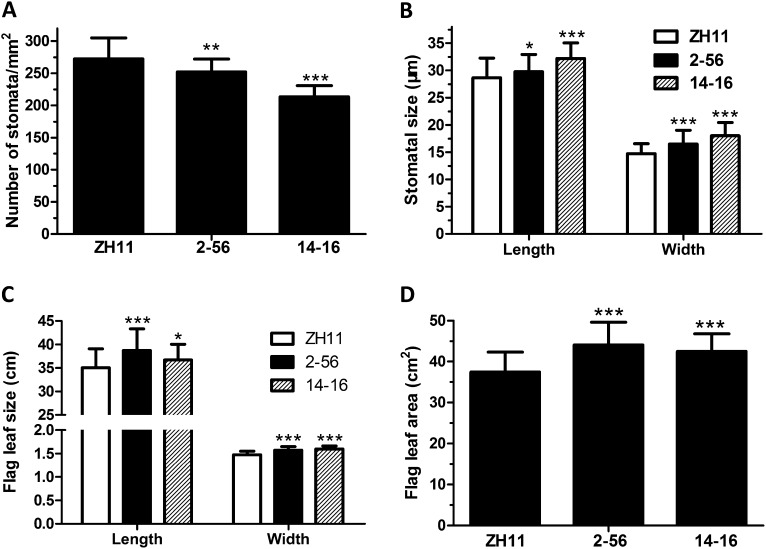
Figure 4.
Reduced leaf stomatal density, enlarged stomatal size, and flag leaf area in the AtEDT1/HDG11 transgenic rice. A and B, Comparisons of stomatal density (A) and stomatal dimension (B) in the ZH11 control and the transgenic plants at seedling stage. Three leaves were sampled for each plant, and 10 plants were sampled for both the control and the transgenic lines. Values are mean ± sd (n = 300, *P < 0.05, **P < 0.01). C, Width and length of the flag leaf. Fifty flag leaves from 30 plants of the transgenic lines and ZH11 were used for measurement, respectively. Values are mean ± sd (*P < 0.05, **P < 0.01, ***P < 0.001). D, The flag leaf area. Leaf area was calculated according to Yoshida et al. (1976): leaf area = leaf length × leaf width × 0.725. Values are mean ± sd (*P < 0.05, **P < 0.01, ***P < 0.001).

