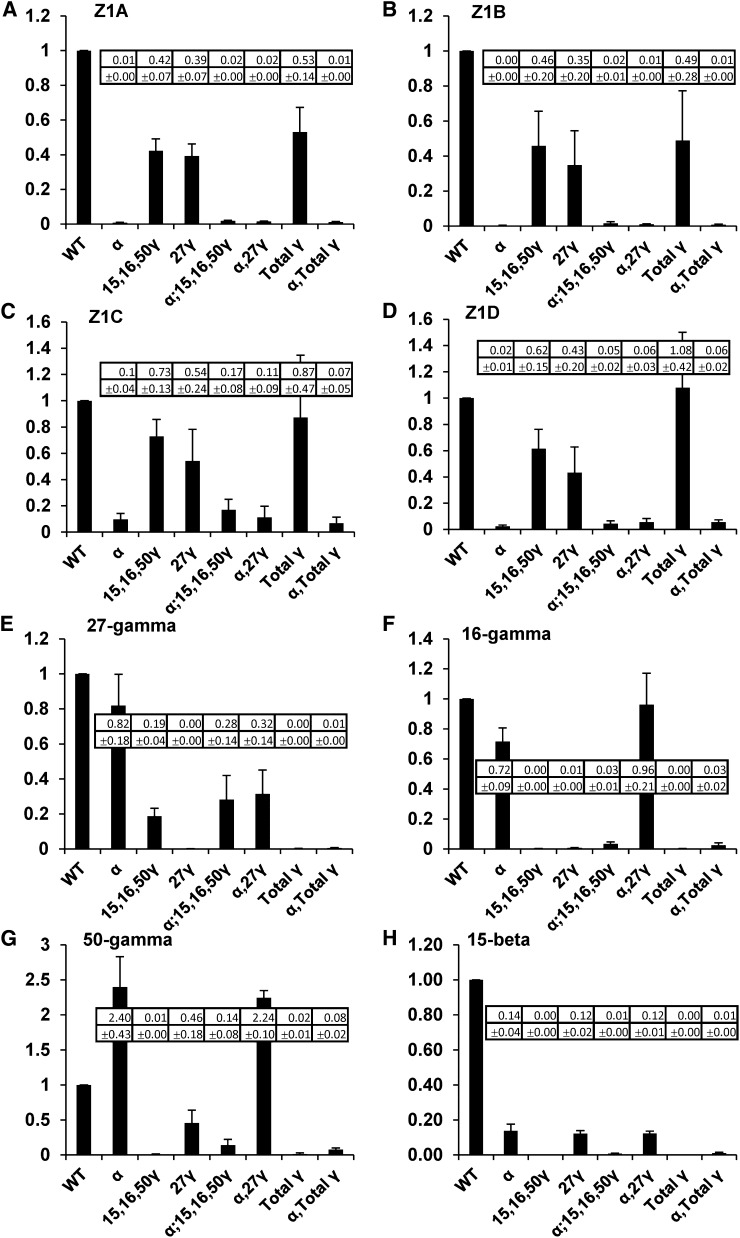
Figure 3.
qRT-PCR expression analysis of α- and γ-zein genes in RNAi lines relative to wild-type nontransgenic (HiII). Each graph represents the measurement of a different zein gene in all the RNAi lines, which are shown on x axes. Values and sd (shown in insert) are the average of three biological replicate kernels and also incorporated three technical replicates of each measurement.

