Figure 5.
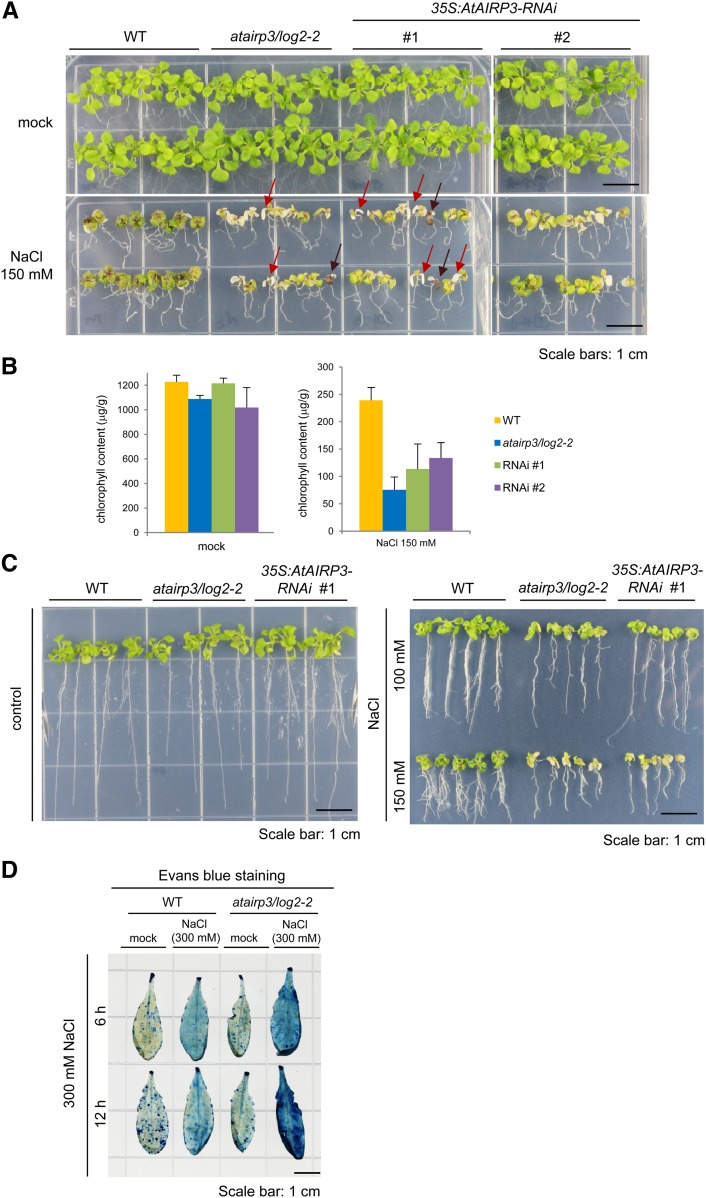
Hypersensitive phenotypes of atairp3/log2-2 knockout mutant and 35S:AtAIRP3/LOG2-RNAi knockdown transgenic plants in response to high salinity. A, NaCl-sensitive phenotypes of atairp3/log2-2 and 35S:AtAIRP3/LOG2-RNAi plants as compared with wild-type (WT) plants. Wild-type, mutant, and RNAi (independent T4 lines 1 and 2) seedlings were grown for 5 d under normal growth conditions and placed in medium supplemented without (top panel) or with (bottom panel) 150 mm NaCl. The morphological abnormalities were observed after 14 d. Some of the atairp3/log2-2 mutant leaves were severely discolored and became whitish or dark brown, as indicated by red and brown arrows, respectively. Bars = 1 cm. B, Chlorophyll content of leaves from wild-type, mutant, and RNAi transgenic plants after salt treatment. Wild-type, atairp3/log2-2, and 35S:AtAIRP3/LOG2-RNAi plants were identically treated as described above, and total leaf chlorophyll levels were measured. Bars indicate means ± sd from three independent experiments. C, Root growth analysis of wild-type, atairp3/log2-2, and 35S:AtAIRP3-RNAi plants in response to different concentrations (0, 100, and 150 mm) of NaCl. Wild-type, mutant, and RNAi (independent T4 lines 1 and 2) seedlings were grown for 5 d under normal growth conditions and placed in medium supplemented without (left panel) or with (right panel) 100 to 150 mm NaCl. The root growth profiles were observed after 14 d. Note that lateral root formation in atairp3/log2-2 and RNAi plants was greatly reduced by high salinity relative to wild-type plants. D, Evans blue staining. Mature, healthy leaves from wild-type and atairp3/log2-2 mutant plants were incubated with 300 mm NaCl for 6 to 12 h. Salt-treated leaves were subsequently treated with Evans blue staining solution. The degree of cell death was determined by the strength of dark blue color. Bar = 1 cm. [See online article for color version of this figure.]

