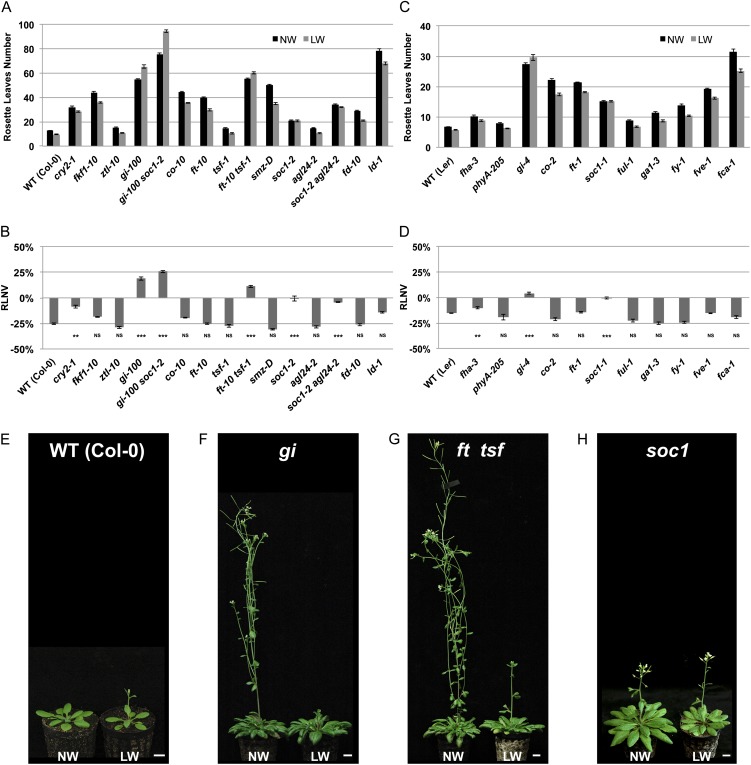
Figure 1.
The DE response requires components of the photoperiodic pathway. A and C, Rosette leaf mean numbers in wild-type (WT) Col-0 (A) and Ler (C) and flowering time mutants grown under LDs. Plants were subjected to normal-watering (NW; black bars) or low-watering (LW; gray bars) regimes. Error bars represent se (n = 15). B and D, Quantification of the DE response for each genotype detailed in A and C, respectively, expressed as relative leaf number variation (RLNV). Numbers indicate percentage variations in number of leaves in plants grown under the low-watering relative to the normal-watering condition. Error bars represent se. Student’s t test values are as follows: **P ≤ 0.01, ***P ≤ 0.001, NSP > 0.05, not significant. E to H, Images of representative plants of the indicated genotypes grown under LDs and subjected to normal-watering or low-watering regimes. Wild-type Col-0 plants are 3 weeks old (E), gi-2 plants are 12 weeks old (F), ft-10 tsf-1 plants are 16 weeks old (G), and soc1-2 plants are 8 weeks old (H). Bars = 1 cm. [See online article for color version of this figure.]

