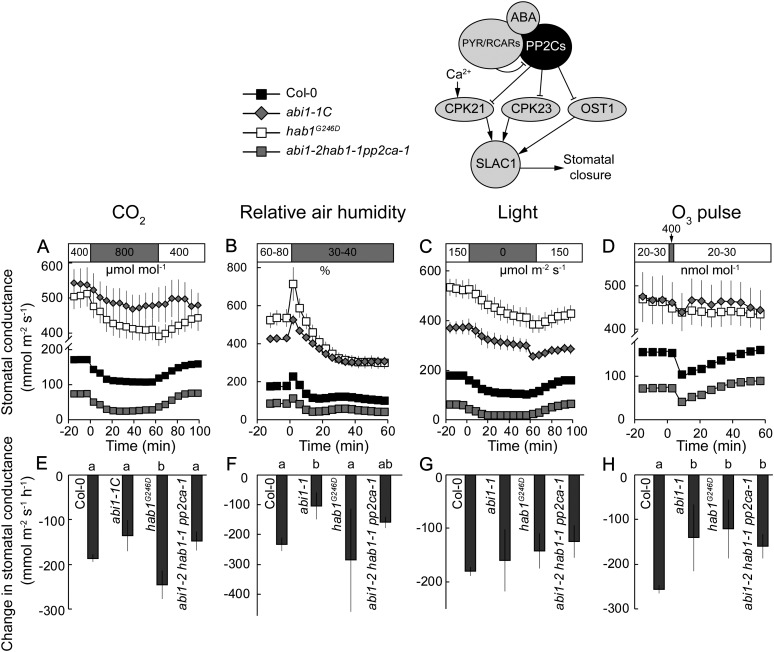
Figure 5.
Time courses of gst in response to elevated CO2 (A), reduced air humidity (B), darkness (C), and O3 pulse (D) together with corresponding changes in gst values (E–H) in dominant mutants of protein phosphatases ABI1 and HAB1 (abi1-1C and hab1G246D) and in the triple knockout mutant of ABI1, HAB1, and PP2CA (abi1-2hab1-1pp2ca-1). Changes in gst values (E–H) were calculated as shown in Figure 3, A to C. Significant differences (P < 0.05; n = 5–50) are denoted with different lowercase letters.

