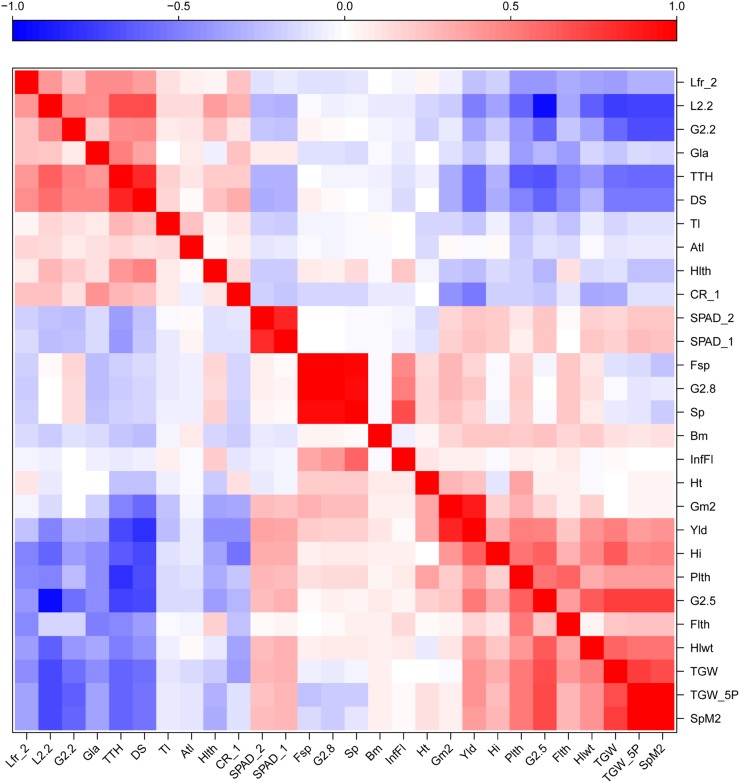
Figure 2.
Heat map of genetic (top) and phenotypic (bottom) correlations between each of the measured agronomic traits of the DH wheat population. The color assigned to a point in the heat map grid indicates the strength of a particular correlation between two traits. The level of correlation is indicated by red for positive correlations and blue for negative correlations, as depicted in the color key. Atl, Number of aborted tillers; CR, crown rot symptom severity; DS, days to senescence; Flth, flag leaf length; G2.8, G2.5, G2.2, the percentage of grains greater than 2.8, 2.5, and 2.2 mm, respectively; Gla, glaucousness; Gm2, grains m−2; Hi, harvest index; Hlth, head (spike) length; Hlwt, test weight; Ht, plant height; InfFL, number of infertile tillers; L2.2, screenings; Lfr_1, leaf rolling at time point 1; Lfr_2, leaf rolling at time point 2; Plth, peduncle length; SPAD_1, chlorophyll content at time point 1; SPAD_2, chlorophyll content at time point 2; SpM2, spikes m−2; TGW, thousand grain weight; TGW_5P, thousand grain weight of five plants; TTH, thermal time to heading; Yld, grain yield. For a detailed description of the agronomic traits, see Supplemental Table S1. The image was made with R (http://www.r-project.org/).

