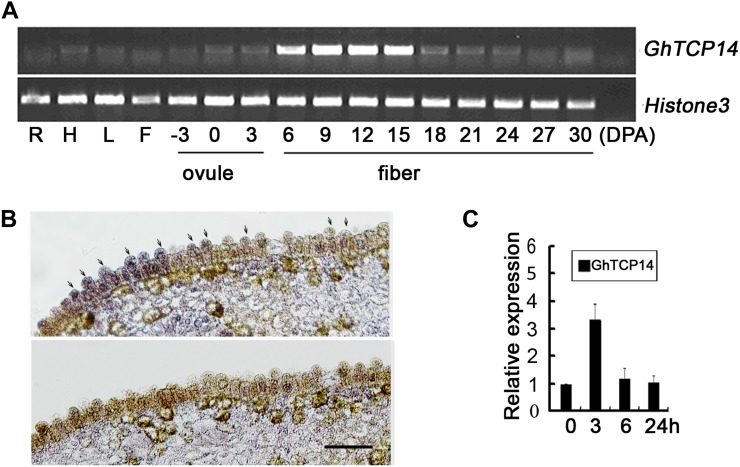
Figure 7.
Expression of GhTCP14 in cotton. A, Transcript profile of GhTCP14 in cotton. R, Root; H, hypcotyl; L, leaf; F, flower. The developmental stages of ovule and fiber are indicated as DPA. The Histone3 gene was used as an internal control. B, In situ hybridization of GhTCP14 transcripts in the ovule (0 DPA) of cotton with antisense (top) and sense (bottom) probes. Arrows show hybridization signals in fiber initials. Bar = 100 µm. C, Expression of GhTCP14 induced by IAA. Quantitative RT-PCR analysis was conducted with the total RNAs extracted from 1-DPA cotton ovules with fiber initials. The value of untreated ovules was set to 1. Error bars represent the sd of three biological repeats. [See online article for color version of this figure.]

