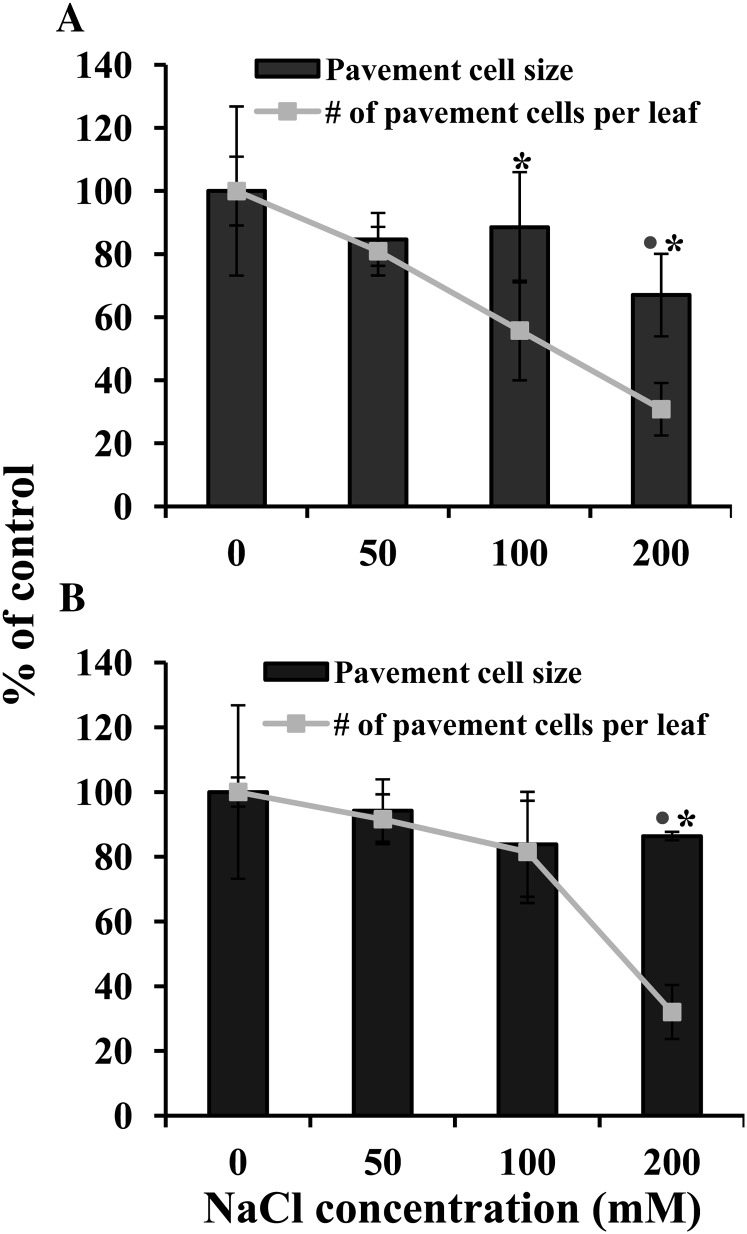
Figure 5.
Effect of salt stress on soil-grown Arabidopsis and E. salsugineum cell number and cell size. A, Arabidopsis. B, E. salsugineum. Data are mean (n = 4) ± sd of the area of the fifth leaf from plants at stage 1.10. Fifty to 90 cells from each leaf were examined. Data are representative of two independent experiments. Dots indicate a significant difference in pavement cell size (P ≤ 0.05, Student’s t test) between control and salt treatment. Asterisks indicate a significant difference in number of pavement cells per leaf (P ≤ 0.01; Student’s t test) between control and salt treatment. Values for 100% average pavement cell size ± sd (mm2): Arabidopsis, 1,798.6 ± 196; E. salsugineum, 2,099.4 ± 95. Values for 100% average number of pavement cells per leaf ± sd: Arabidopsis, 166,995 ± 44,757; E. salsugineum, 90,855 ± 2,714. For average cell numbers and cells sizes under salt stress, see Supplemental Table S3.

