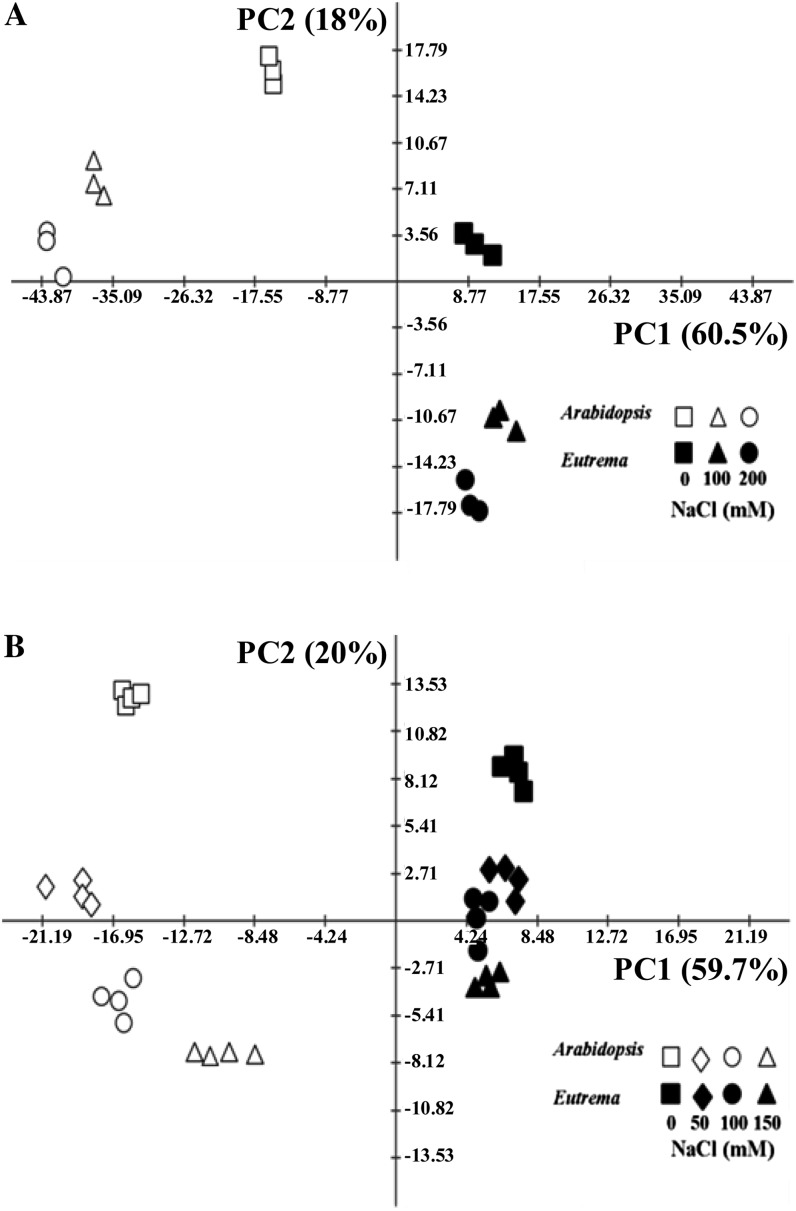
Figure 6.
PCA of metabolic profiles of (A) in vitro-grown (stage 1.06 [stage 1.04 – Arabidopsis 150 mm NaCl]) and (B) soil-grown Arabidopsis and E. salsugineum plants (stage 1.10) under control and salt-stress conditions. Arabidopsis and E. salsugineum are separated along principal component 1 (PC1) while the effect of salt stress is discriminated along principal component 2 (PC2). Variance explained by each component is indicated in brackets. Data are representative of similar results from three independent experiments.

