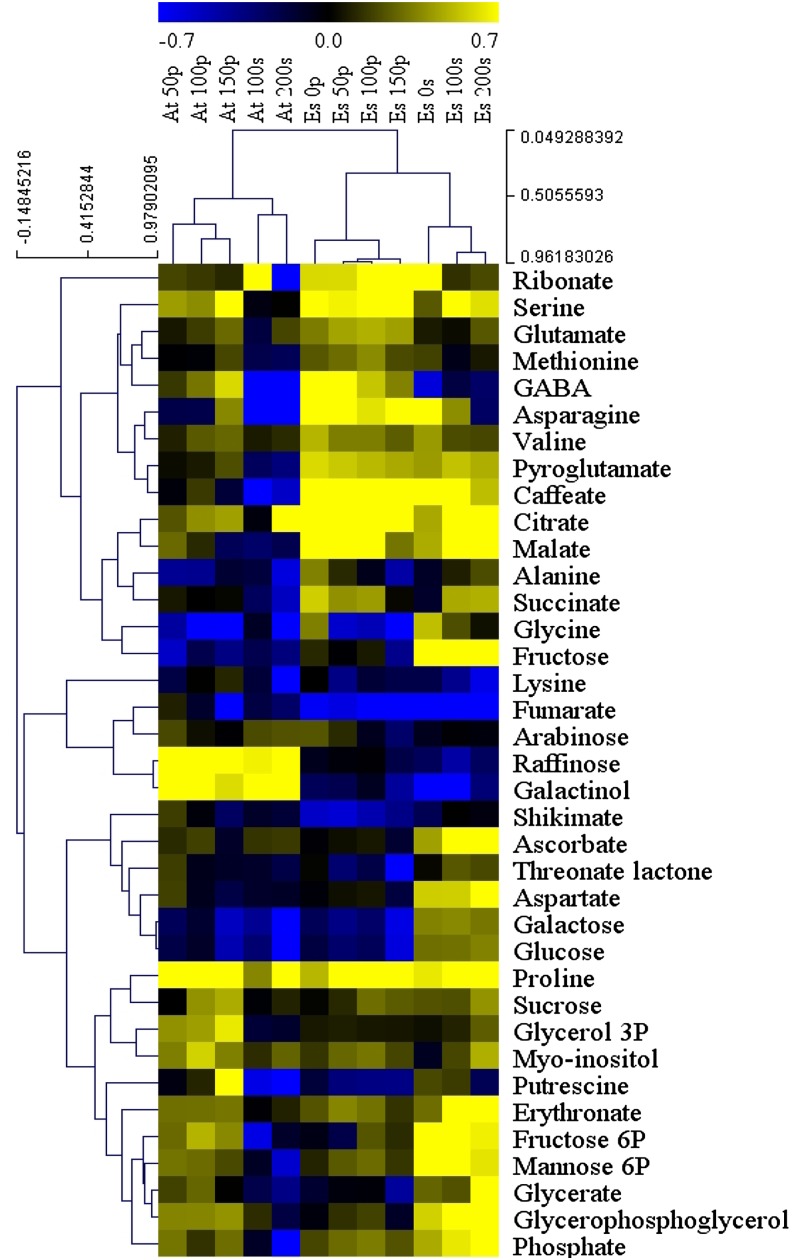
Figure 7.
Hierarchical clustering analysis of metabolites from in vitro- and soil-grown Arabidopsis and E. salsugineum under control and salt-stress conditions. Data are expressed as log10 ratios over Arabidopsis control values. At, Arabidopsis; Es, E. salsugineum; P, plates (in vitro); S, soil. Numbers indicate NaCl concentration.

