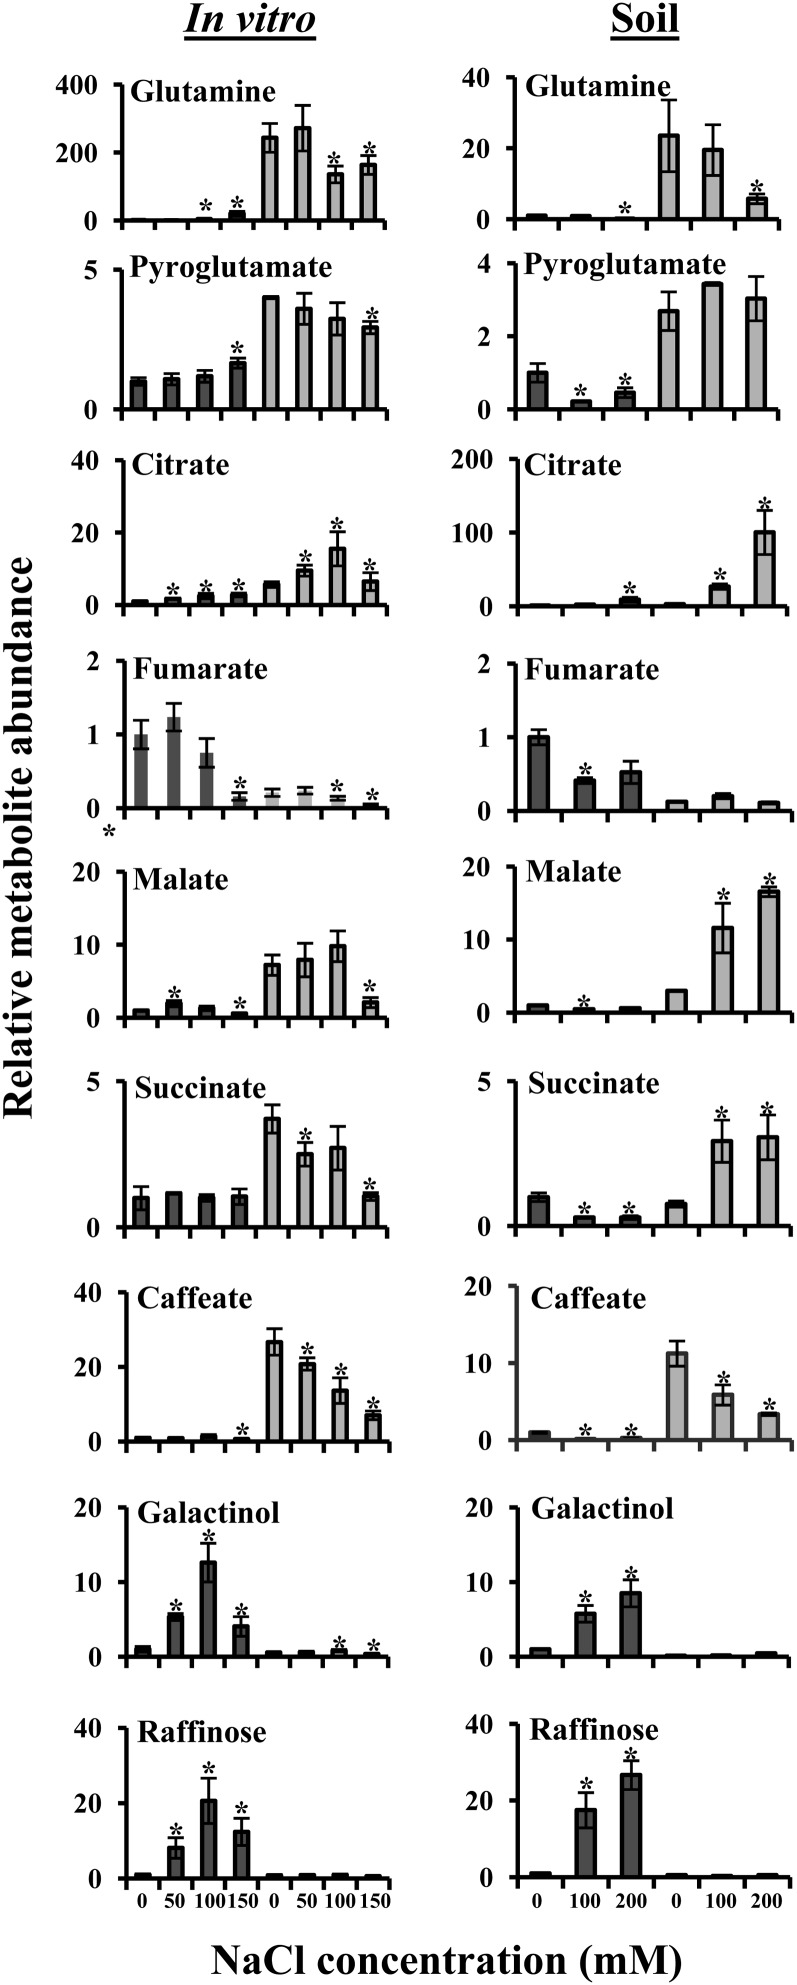
Figure 9.
Growth platform-independent Arabidopsis (dark gray bars) and E. salsugineum (light gray bars) salt response metabolic signatures. Abundance of each metabolite was normalized to the Arabidopsis control level, which was assigned a value of 1. Data are mean (n = 4, in vitro; n = 3, soil) ± sd and are representative of three independent experiments. Asterisks represent significant difference (P ≤ 0.05, Student’s t test) between Arabidopsis or E. salsugineum and their respective controls.

