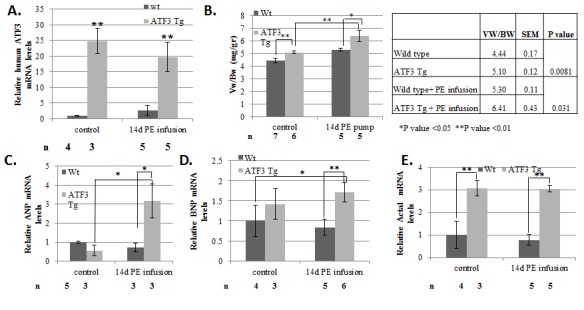
Figure 5. Adult-ATF3 expressing mice display increased Vw/Bw growth ratio in basal and following PE infusion.

A. RT-qPCR analysis for cDNA derived from either wild-type or ATF3 transgenic mice. mRNA was extracted from ventricles derived from wild-type (black) or adult-ATF3 expressing (gray) and RT-qPCR was performed with the hATF3 specific primers. B. Mice ventricles weight (Vw) relative to mouse body weight (Bw) is calculated (mg/gr). The results represent the mean and SEM of the indicated number of animals (n). The mean and SEM of the absolute values is provided (right panel). C–E. RT-qPCR with cDNA from A was performed with the indicated specific primers: C. ANP. D. BNP. E. Skeletal actin (Acta1). The results represent the mean expression relative to GAPDH of the indicated number of animals (n). Asterisks (*/**) indicate a P value <0.05 or <0.01 respectively of a one-tailed t-test compared to wild-type mice.
