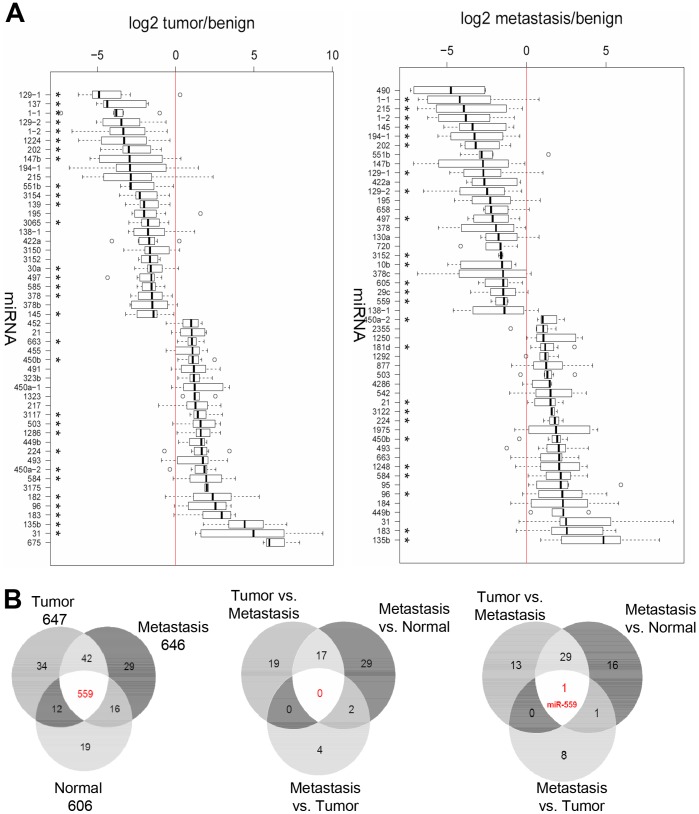
Figure 1. Differential expression of miRNAs in colon tumor and metastasis tissues.
(A) Top 25 up- and down-regulated miRNAs comparing tumor (left) or metastasis (right) tissues versus normal colon samples as analyzed by Illumina sequencing. All depicted miRNAs sufficed a p-value threshold ≤0.05. A star indicates samples with p≤0.01. (B) Venn diagram of microRNAs expressed in colorectal cancer patients, as determined by Illumina sequencing. (Left) Numbers of detected miRNAs, specific for each tissue (normal (N) = 19, tumor (T) = 34, metastases (M) = 29) and in all tissues (559). (Middle) Venn diagram of the significantly up-regulated miRNAs (p-value ≤0.05) for all comparisons (N/T, N/M and T/M). (Right) Venn diagram of the significantly down-regulated miRNAs (p-value ≤0.05) for all comparisons (N/T, N/M and T/M).

