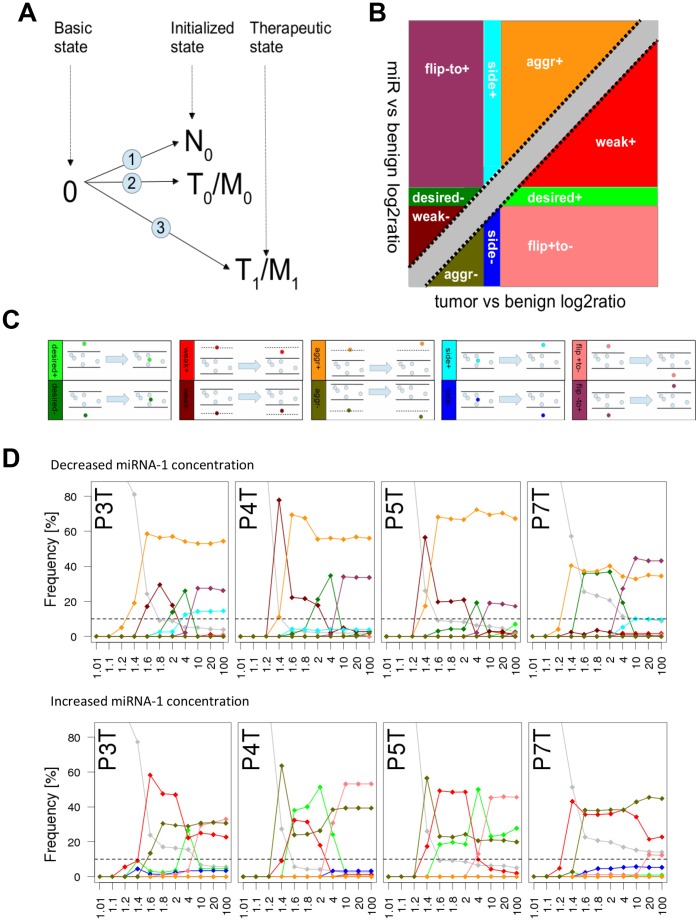
Figure 4. In silico modeling of the individual response of 4 patients to either miRNA-1 down-regulation or miRNA-1 drug treatment using a Monte Carlo-based computational cancer model integrated in PyBios.
(A) Schematics of the modeling approach: mRNA-Seq data from the tumor or metastasis of each patient was used to initialize the in silico model (T0/M0). After ‘treatment’ of the model with different miRNA concentrations, the ‘therapeutic state’ model (T1/M1) was compared to the mRNA-Seq data of the normal tissue of the same patient (N0). (B,C) We compared the expression changes induced by miRNA-1 dosages to the expression changes originally found in the tumor. In both cases changes were calculated in comparison to the normal tissue expression as log2ratios (T-N and miR-N). Predicted component concentration changes in the model were classified into five different groups (or 10 different sub-groups) depending on the changes between the T-N and miR-N log2ratios: ‘Desired’ (desired therapeutic effect, component concentration levels back to 'normal'), ‘weak effect’ (weak effect in changing the component concentration but tendency to 'normal'), ‘side effect’ (negative therapeutic effect), ‘aggravated’ (component concentration aggravated in the same direction) and ‘flip’ (component concentration status flips from up- to down-regulated or vice versa). Each group can be divided into two sub-groups ‘plus’ and ‘minus’ which depicts an initial up- or down-regulation of a component in the tumor normal comparison as determined by a log2ratio cutoff greater than 0.58 or smaller than −0.58 respectively. (D) miRNA-1 was either decreased (top row) or increased (bottom row) for the tumor tissues of patient 3, 4, 5, and 7 and gene expression changes were observed in a dose-dependent manner. Different concentrations of miRNA-1 are visualized as scatter plots where the frequency reflects the ratio of the number of compounds contained in each classification-subgroup to the sum of all compounds; only those components were considered which were either higher than 1.2-fold up-regulated or lower than 0.8-fold down-regulated in comparison to the control state.

