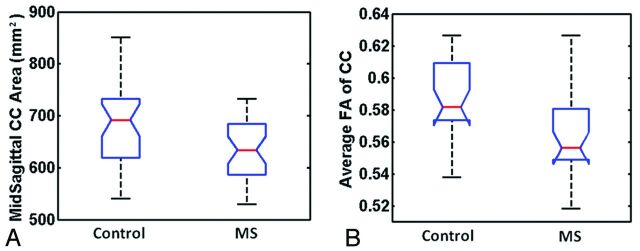
Fig 4.
Structural differences measured with midsagittal CC area (A) and the FA of the entire CC (B) between patients with MS and control participants showed a significantly reduced midsagittal CC area (P = .026) and FA (P = .0018) in patients compared with control participants. The boxes have lines at the lower quartile (horizontal blue lines), median (horizontal red lines), and upper quartile values. The whiskers are lines extending from each end of the boxes to show the extent of the rest of the data. The “notch” marks the 95% confidence interval for the medians, which can be used to differentiate 2 groups. Namely 2 medians will differ significantly with P < .05 if the 2 notch intervals do not overlap.

