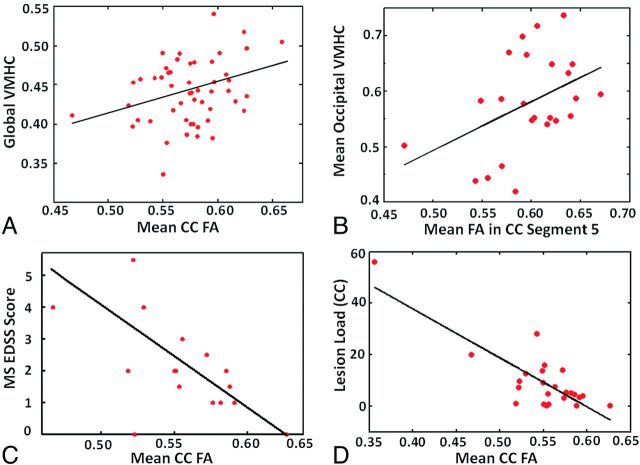
Fig 5.
Mean FA of the entire CC and global VMHC in all participants (A) showed significant positive correlation (r = 0.3; P = .03). Mean FA of CC segment 5 (occipital projections) and mean VMHC in the occipital regions showed significant positive correlation (r = 0.43; P = .037) in patients with MS (B). There was a significant negative correlation between the Expanded Disability Status Scale score and the mean FA of CC (r = −0.61; P = .013) in the patients (C). The mean FA of CC also significantly correlates with the lesion load (r = −0.92; P < .0001) (D).

