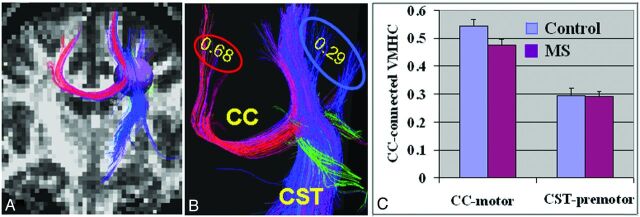
Fig 6.
Interhemispheric and intrahemispheric structural and functional connectivity of cortical motor regions. A, On the basis of whole-brain fiber tractography from FA images, a sphere with a radius of 4.5 mm was placed in the posterior motor triangle area as a seed to select both transcallosal (interhemispheric fibers indicated in red) and nontranscallosal CST (intrahemispheric fibers indicated in blue) motor fibers to define the connecting terminal cortices for VMHC evaluation. B, A representative example of different VMHC values in 2 separate terminal regions showed higher VMHC (0.68) in motor regions connected with transcallosal fibers compared with premotor regions (0.29) projected by nontranscallosal CST fibers. C, Group comparison of transcallosal VMHC and nontranscallosal VMHCs showed much higher value in transcallosal regions. There was significantly reduced VMHC in transcallosal motor regions in patients compared with control participants (P = .03) but not in nontranscallosal CST regions (P = .09).

