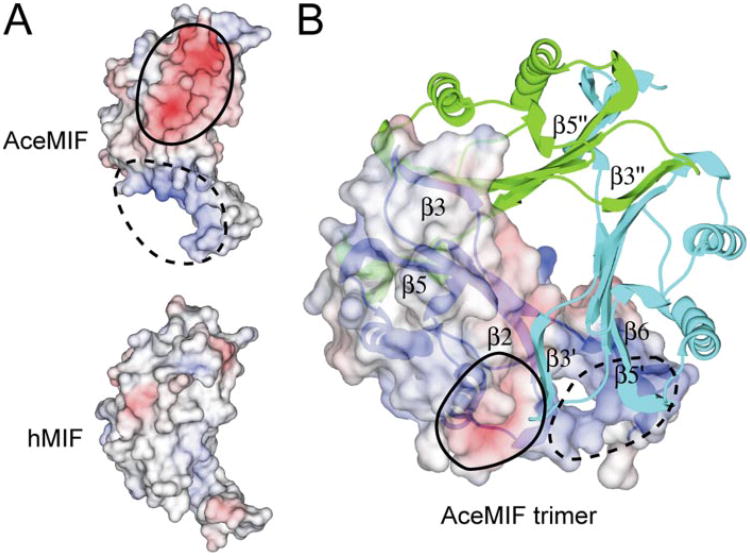
Figure 4. Electrostatic surface potential of AceMIF and hMIF.
The negatively charged surface potential is colored in red and the positive potential in blue. These potentials are circled with solid or dashed lines in each of the panels. A, electrostatic potentials of AceMIF or hMIF are depicted on the surface of each protomer. B, charged surface potential for one monomer is shown in the context of the trimer, with the other subunits drawn as ribbon diagrams. β-Strandsof theunsurfaced subunits are labeled with single and double primes.

